
CASA News
Issue 5
26 September 2017

CASA News
Issue 5 • 26 September 2017
From the Lead
As you may know, Jeff Kern has moved to another role at NRAO, directing the development of Science Ready Data Products (SRDP). This work will be described in a future CASA News and is anticipated to dovetail with CASA. We thank Jeff for his years of service and dedication to CASA. His leadership and expertise have had a significant impact on making CASA the system that it is today. We wish him well in his new role.
We have been seeking a new CASA Lead this summer, and after an extensive search have hired Ryan Raba. Ryan has degrees in Astrophysics and Computer Engineering from Penn State, and a Master’s of Science degree in Systems Engineering from Cornell. He worked on digital signal processing techniques with interferometers at Lockheed Martin, and after 13 years there, moved to the Federal Bureau of Investigation, where he has worked for the past 6 years as an investigative Computer Scientist and program manager of a large distributed team. His strong background and leadership experience will help CASA continue to develop.
I would also like to introduce Bjorn Emonts who has joined NRAO as our CASA Liaison. Bjorn has a background in radio interferometry, and uses his expertise in centimeter/millimeter spectroscopy to trace the life-cycle of cold gas in the environments of radio galaxies. Bjorn obtained his Ph.D. from the University of Groningen (Netherlands), and held fellowship positions at Columbia University, the Australia Telescope National Facility, and the Center for Astrobiology (Madrid). As the CASA User Liaison, his interests are to help optimize and promote CASA for general use, as well as to push the capabilities of radio observatories (VLA and ALMA), to help the community further explore the cold atomic and molecular Universe.
In the past year, we released CASA 5.0 and 5.1. As part of the 5.0 release, the CASA Docs documentation system was introduced, with the intention of improving user access to CASA documentation. Significant changes to visualization, a fix for VLA tropospheric delay (first delivered in 4.7.1), and the single-dish transition to the measurement set in 5.0 and 5.1 are all described below.
The major ALMA Cycle 5 development highlights and ALMA Cycle 4 support releases are summarized in the ALMA Pipeline Update. A version of the pipeline supporting VLA Sky Survey calibration and imaging was delivered for the September startup of observations. More information will be provided in a future CASA News.
The ALMA/NRAO Help Desk article outlines useful changes to the Help Desk. Radio-astro-tools describes additional data reduction tools which may be useful with CASA. Finally, we have an article on the pre-release of thee Cube Analysis and Rendering Tool for Astronomy (CARTA), the future CASA visualization tool. This pre-release is a basic version with limited functionality for initial testing.
CASA Users Committee Input Solicited
The CASA Users Committee will meet 8 – 9 November 2017 and is soliciting input from the community regarding topics of concern or interest that the community would like the Committee to probe on their behalf. If you have any such input, please send it by 22 October 2017 to the CASA Liaison, Bjorn Emonts, who will collate all inputs for the Committee.
CASA Releases 5.0 and 5.1
With CASA 5.0 and 5.1, we have released two versions of CASA with significant enhancements. The most significant changes are, however, under the hood with a new, unified way to access, store, and process visibilities for tasks and tools, and code and performance improvements. We also implemented a new internal workflow and build process. As a result of the latter, we now have regular CASA 'prerelease' builds but no more ‘stable’ or ‘test’ versions. Prereleases are numbered and the final prerelease of a development cycle turns into an official CASA release after intense testing and documentation updates.
In CASA 5.0, we also introduced 'CASA Docs' as our new one-stop documentation system that combines information from the Reference Manual & Cookbook, the inline help, and other material that was available on the CASA webpages. We took on the opportunity to also significantly review all chapters to present the information more uniformly. CASA Docs is still in a transition phase and updated task and tool documentation is being added over time. For more information, see the CASA Docs article in this newsletter.
Another new feature in CASA is an optional crash reporter that will provide us with information when CASA fails.
For CASA 5.1, we focused on ALMA and VLA/VLASS pipelines that are also described in more detail in other articles in this newsletter.
Additional new CASA features include the full usage of WEIGHT_SPECTRUM for all calibration tasks, autoboxing capabilities for tclean, more plotting options in plotms, a new task and tool to create rms images, and the restructuring of single dish tasks (see also the single dish article in this newsletter),
We updated the iPython version and CASA now generally uses more standard Python syntax, which includes the deprecation of the T/F shortcuts for Boolean True/False, and the need to create global tool instances when used outside the command line interface.
For a listing of all new features, see the CASA 5.0 and CASA 5.1 release notes in CASA Docs.
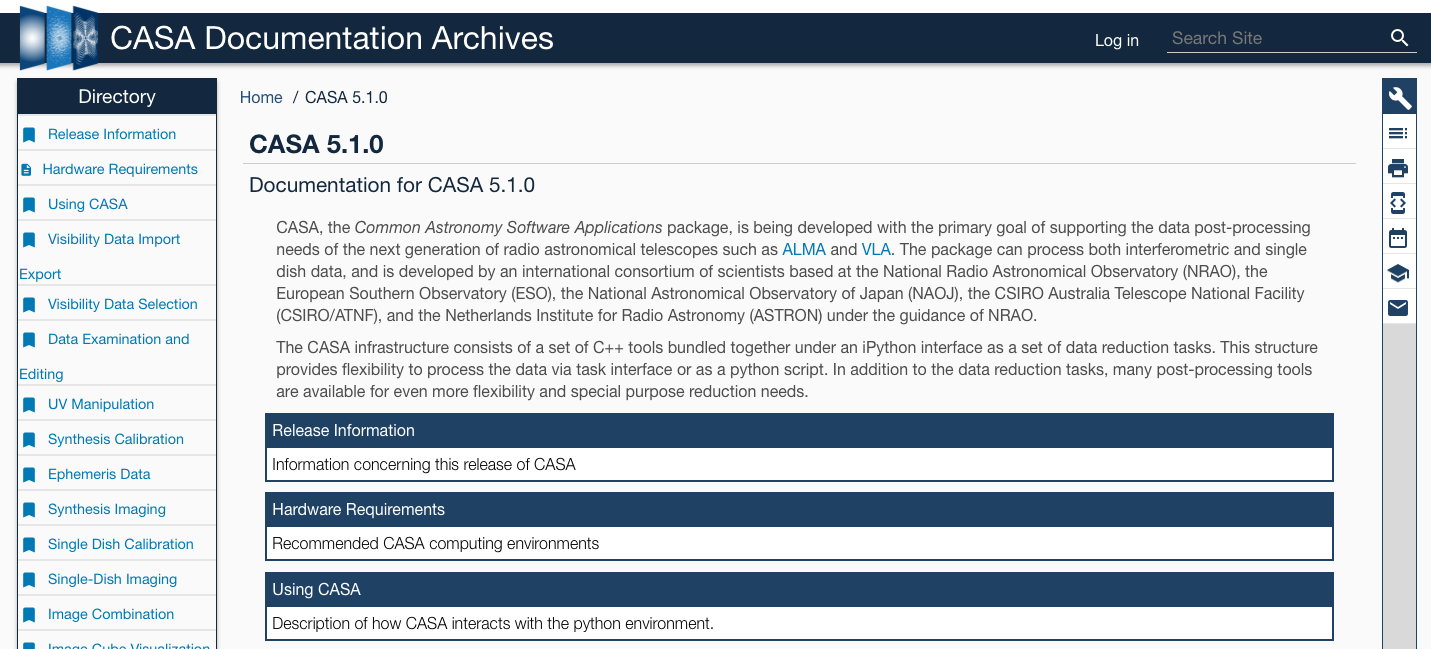
CASA Docs: The new CASA Documentation System
[click to enlarge]
The CASA 5.0.0 release includes a completely new browser-based documentation system. Called CASA Docs, the new system is available online and is packaged with each CASA build for convenient offline use. The CASA Docs will eventually replace the multiple historical sources of CASA documentation: the CASA Reference Manual and Cookbook, the command line task and tool help, the CASA Task Reference Manual, the CASA Toolkit Manual, and other miscellaneous CASA documents. The CASA Docs come with a new CASA command, doc(), which opens the CASA Docs in a browser window.
The CASA Docs are structured in chapters that cover topics including installation instructions, recommendations on best practices, an explanation of the data reduction philosophy, global task and tool lists, and reference material. The new CASA Docs also include the Release Notes and Known Issues pages that were previously linked from the casa.nrao.edu homepage; the complete change log for each release will be added soon.
In addition to the regular user-focused documentation, CASA Docs includes advanced developer-oriented documentation. This developer content is hidden by default, but can be made visible using a “Developer Mode” toggle button. The new CASA Docs has a built-in search capability to enable quick access to information. We have also included a convenient “Contact Us” button that allows users to send in suggestions or point out typos.
The CASA 5.0.0 CASA Docs system includes all essential CASA information including the vast majority of background material from the CASA Cookbook, as well as documentation on the most popular CASA tasks. The remaining background information and documentation for all other tasks and tools will be added to CASA Docs in subsequent releases. For now, the classic command line task and tool help, available using the help() command, remains as in previous CASA versions. However, in a subsequent release, the help() command output will only provide a summary of task parameters and tool methods; all descriptive information regarding tasks and tools and examples of their use will be moved to the CASA Docs and will be accessible using the doc() command. Similar to help(), the doc() command will accept task and tool string names, for quick access to documentation.
To get started using CASA Docs, navigate to the CASA Docs website, select a Release version – note that CASA Docs also contains documentation for the under-development CASA prerelease – start the CASA Docs tutorial by clicking the wrench icon in the top right of the screen, and in the Tutorials section click “Introduction.” Happy reading!
Visibility Retrieval and Processing with VisibilityIterator2
In CASA release 5.0, the development team began extended deployment of a new underlying data iteration and retrieval mechanism called "VisibilityIterator2" or "VI2". This ongoing effort has occupied significant development resources over the past few years, and while the details of VI2's internal operation should remain largely transparent to users, it will make possible a wide range of on-the-fly data processing options (and combinations thereof) uniformly available across many CASA applications, including calibration, plotting, imaging and data export. In this CASA newsletter, we describe its basic properties and anticipated advantages.
Any application which processes visibility data from a MeasurementSet requires an underlying mechanism to retrieve it in a systematic and organized way, especially considering the large and complex datasets produced by modern instruments. CASA's traditional iteration mechanism ("VI1") was fairly rudimentary, mainly providing a simple linear iteration through the MeasurementSet on large-scale data axes (scan, time, spectral window, etc.) – a moving window or buffer on the data. Beyond serving the data in organized chunks, the core responsibility of the VI1 was to drive the deeper I/O mechanism that reads and writes the data to/from disk. In general, each window contained all baselines for a unique time and spectral window, and the data container (the "VisBuffer") was mutable for local processing purposes by the application needing it. Additionally, various data-conditioning operations (averaging, pre-calibration, grouping of multiple VisBuffers, etc.) were managed locally and explicitly by each application needing them. For example, calibration solving (gaincal) and data plotting (plotms) used distinct code for data averaging. As such, different code for similar operations appeared and evolved independently throughout CASA, making it more difficult to maintain the code in a consistent and uniform manner.
To remedy this situation, the VisibiltyIterator2 was conceived and implemented. Fundamentally, the design was intended to clean up the overly-permissive mutability properties of the VisBuffer (for better internal accountability), and better centralize a broader range of generalized data iteration/retrieval and pre-processing services, and thereby provide a more robust and extensible platform upon which most CASA applications access the visibilities. Furthermore, the range of generalized pre-processing services (averaging, calibration application, etc.) are realized as substitutable and sequentially layerable implementations of the basic iteration mechanism, and presented in aggregate to application code via a standardized interface. In this way, all manner of standardized on-the-fly pre-processing options can, in principle, be layered at will, and the application code itself can remain relatively agnostic about organizing this, other than to supply adequate configuration information to the VI2. Critically, the on-the-fly layering will permit serving suitably pre-processed data for any application with only one I/O pass through the raw data in the MeasurementSet. Layerable implementation layers will include calibration, frequency-averaging, time-averaging, polarization averaging/conversion, frequency axis smoothing/convolution, weight estimation, (uv) continuum subtraction, spectral window aggregation, and possibly others. Ultimately, the combinations will only be limited by what it makes sense to combine sequentially. Further, the bottom-most I/O-driving layer is also sufficiently modular as to permit transparently substituting aynchronous or otherwise-parallelized or optimized I/O mechanisms as needs dictate.
Currently, calibration solving and application tasks (gaincal, bandpass, polcal, applycal), tclean, plotms, and mstransform are exercising the VI2, and informing continuing improvements and refinements. The full-flexibility layering mechanism will be made incrementally available in forthcoming releases, most notably in mstransform, which will support an appropriate range of processing options for generating processed and condensed datasets from raw or otherwise processed MeasurementSets. Stay tuned to upcoming CASA release notes and this newsletter for announcements in this area.
CASA Pipelines Update
I. ALMA Cycle 5 Development Highlights
The last CASA newsletter was published just as the ALMA Cycle 4 pipeline release, which included the first version of the ALMA imaging pipeline, was being prepared for final acceptance. This newsletter coincides with the final testing and acceptance process for the ALMA Cycle 5 pipeline release, which includes among many improvements to the already operations pipelines, the first official version of the pipeline for the VLA Sky Survey (VLASS). The major Cycle 5 development highlights and Cycle 4 support releases are summarized below.
Pipeline heuristics development highlights:
- new flagging and imaging autoboxing heuristics for the ALMA interferometry pipeline (see sections II and III below)
- new polarization calibration and quick look imaging heuristics for the VLASS pipeline (see sections V and VI below)
- new quality assessment heuristics for the ALMA single dish pipeline (see Section IV below).
Pipeline framework development highlights:
- improved support for end-to-end high-performance-computing operations for the ALMA pipelines
- support for representative source identification and quality assessment for the ALMA pipelines
- improved memory management and a new restore data capability for the ALMA single dish pipeline
- a new imaging heuristics parameter handling framework target for VLASS but useful for all pipelines
- a new quality assessment metric and score handling framework for all pipelines.
Pipeline support highlights include mid-cycle deployment of image size mitigation heuristics to support ALMA Cycle 4 long baseline operations.
Selected development highlights are detailed in the following sections.
II. Autoboxing Support in the ALMA Interferometry Pipeline
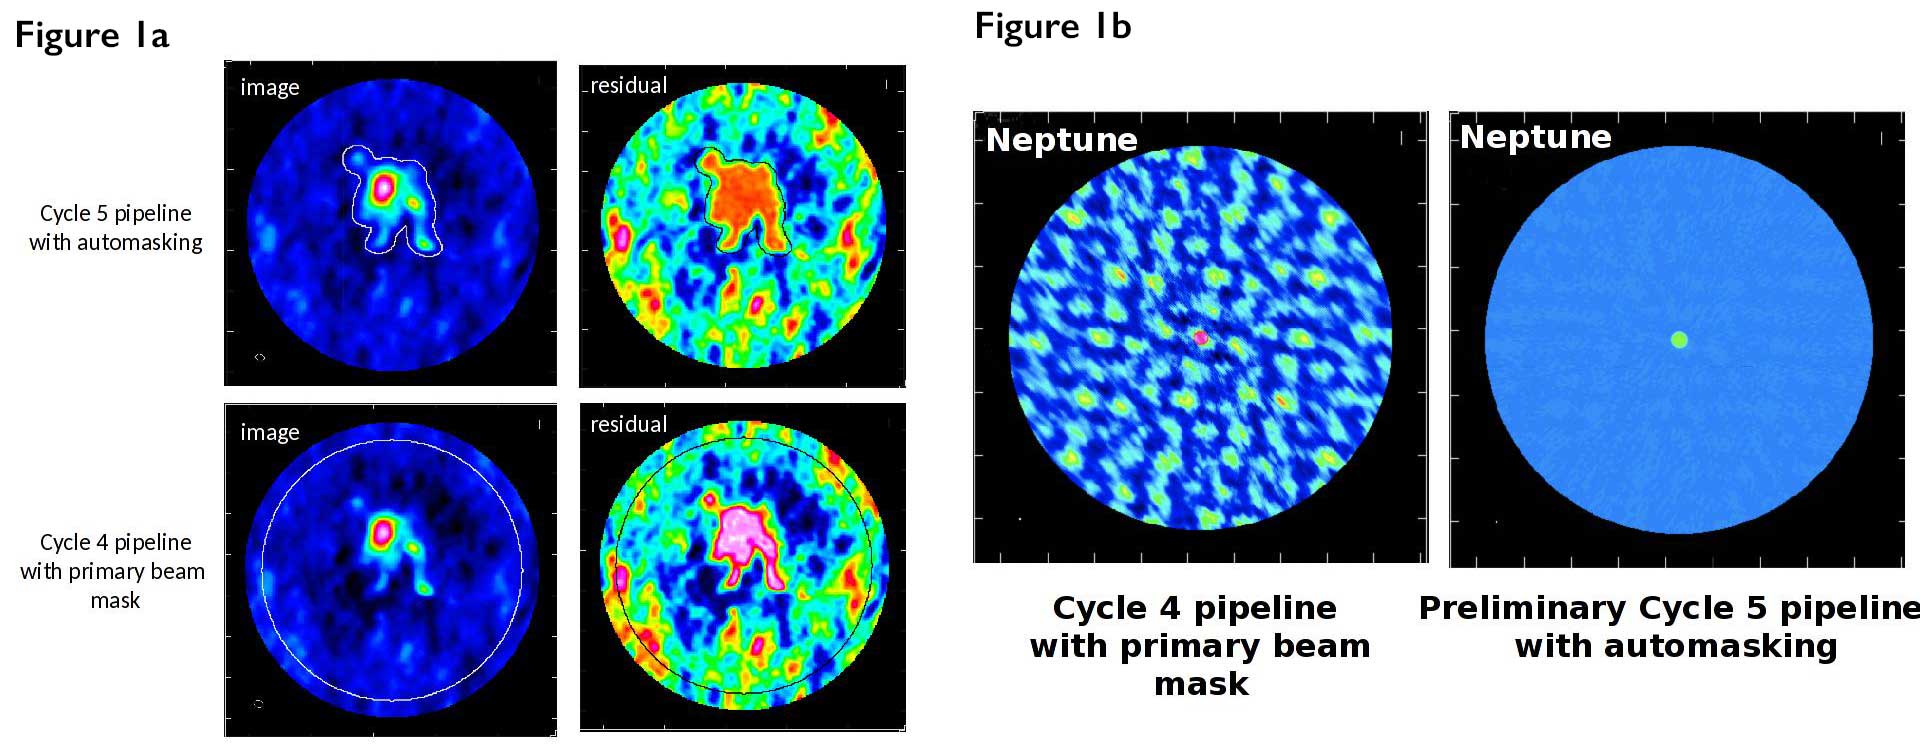
A. Kepley
Figure 1a & 1b: Imaging results obtained with autoboxing (Cycle 5 pipeline) and the standard primary beam masking (Cycle 4 pipeline) for a science target and a flux calibrator
[click to enlarge]
For ALMA Cycle 5 the interferometry pipeline imaging tasks replace the original primary beam masking algorithm with the new CASA tclean autoboxing algorithm. The autoboxing parameters are tuned using heuristics developed by the pipeline working group, which are based on a combination of the target source intent (calibrator / science), the array (12m / 7m), and the length of the representative baseline. If the autoboxing algorithm fails, masking reverts to the Cycle 4 masking heuristics. If autoboxing is successful, the cleaning threshold is set ~two times lower than it was for Cycle 4, enabling a deeper clean. See examples in Figures 1a and 1b.
III. New Flagging Heuristics in the ALMA Interferometry Pipeline
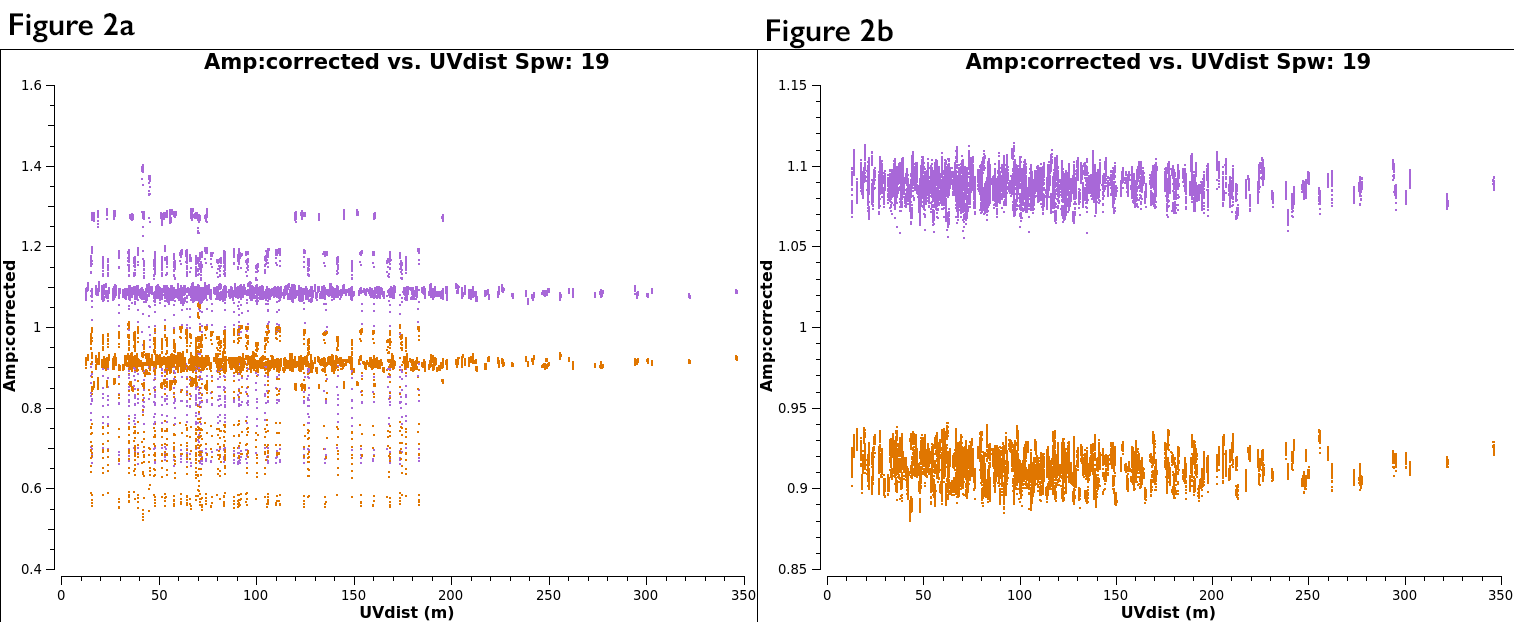
Figure 2a & Figure 2b: Corrected amplitude versus uv distance, color-coded by correlation. Fig. 2a shows the data with the initial calibration applied, Fig. 2b is after the outlier points have been flagged.
[click to enlarge]
For ALMA Cycle 5 the original gainflag flagging heuristics have been replaced with new heuristics which search for outlier visibilities in the scalar difference of the (corrected - model) calibrator (bandpass, flux, and phase) amplitudes and flags them. Only outliers which remain outliers after calibration are flagged. If visibilities are flagged, the calibration is recomputed. The new flagging heuristics are tuned to detect both bad antennas and bad baselines. They work equally well for resolved or point source calibrators because the algorithms uses scalar amplitude differences. Flags detected in outlier phase calibrator visibilities are propagated to the science target sources. See examples in Figures 2a and 2b.
IV. ALMA Single Dish Pipeline Improvements
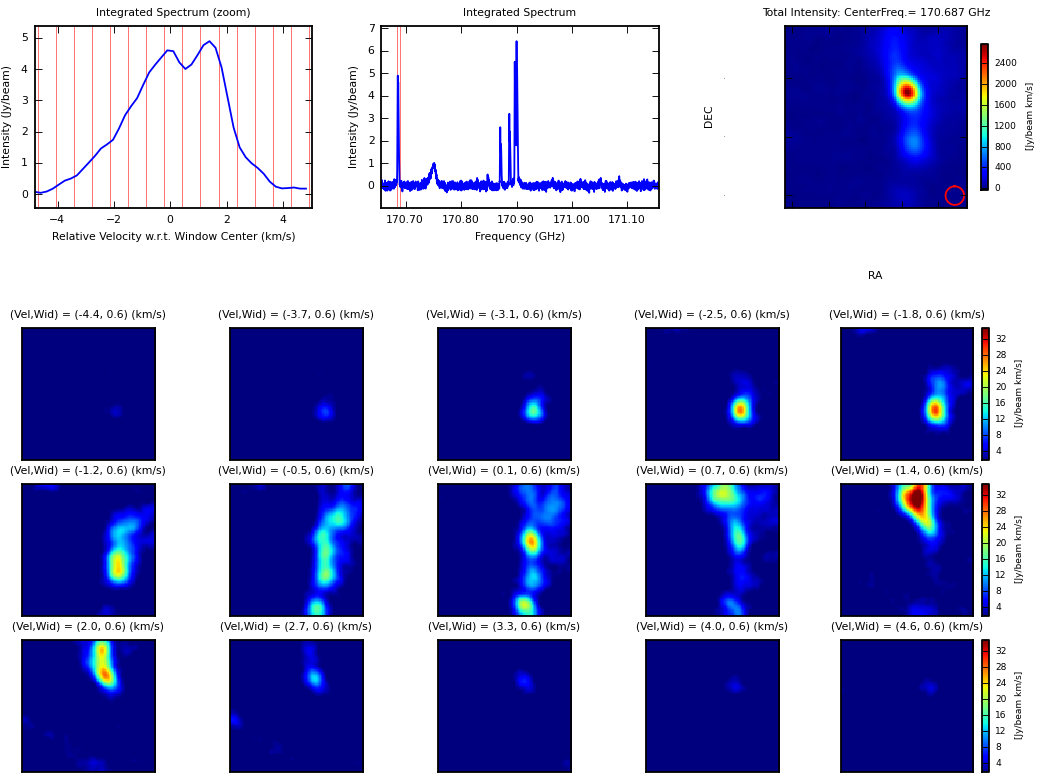
Figure 3: Single dish Band 5 line observations of M42.
[click to enlarge]
For ALMA Cycle 5, the ALMA single dish pipeline added support for processing Band 5 observations, single polarization observations, and many improvements to the quality assessment metrics, including sensitivity estimation. The ALMA single dish pipeline tasks are also supporting development of a pipeline for the Nobeyama 45m telescope.
A new task for restoring the single dish pipeline calibration and flagging state from data products stored in the Archive has been written. This task brings the single dish pipeline into alignment with the interferometry pipeline(s) and will improve the data product delivery process. The single dish pipeline memory footprint has been significantly reduced.
V. Circular Polarization Calibration for the VLASS Pipeline
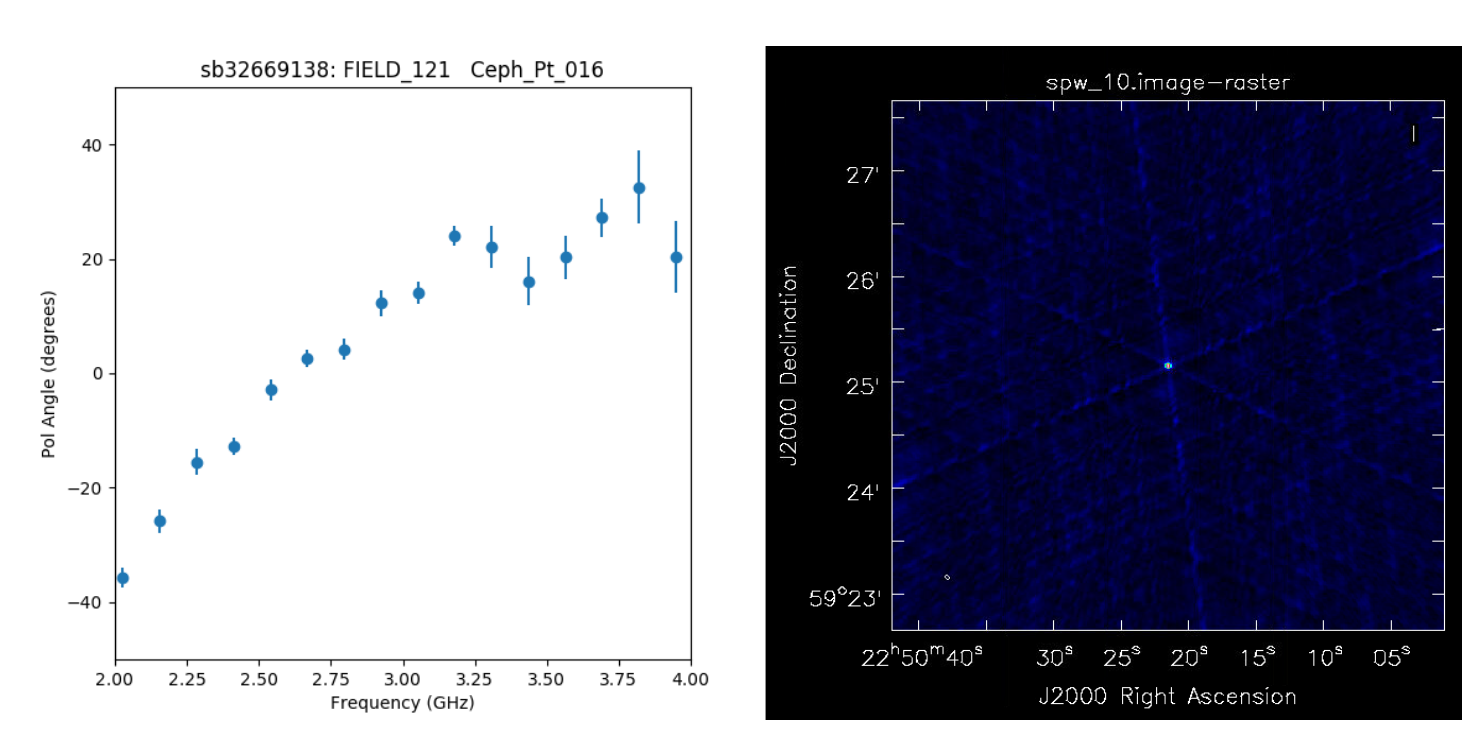
Figure 4: Sample publicly-available VLASS Pilot data with a rotation measure plot for a source calibrated with the VLASS pipeline.
[click to enlarge]
The Jansky VLA circular polarization calibration heuristics have been developed, implemented, and deployed in the VLASS calibration pipeline for Cycle 5. The new heuristics are dependent on observation of the primary flux calibrators 3C286 or 3C48 and the availability and number of polarization leakage and polarization angle calibration scans. See Figure 4 for an example.
VI. Quick Look Imaging for the VLASS Pipeline
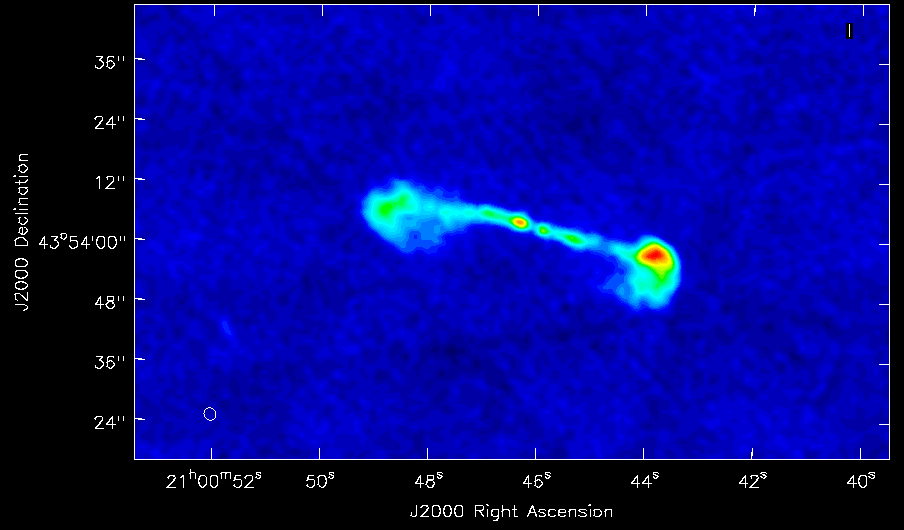
Figure 5: Sample quick look image cutout of an interesting source, extracted from a much larger image produced by the VLASS pipeline.
[click to enlarge]
The Cycle 5 pipeline software includes a new task, developed initially to support the VLASS quick look imaging pipeline, for tuning the VLASS imaging parameters. VLASS imaging parameters are survey mode driven, e.g. fixed image cell size, rather than observing mode driven as for ALMA, e.g. cell size depends on maximum baseline. To support this and other new imaging pipelines, the imaging tasks have been refactored to encapsulate the heuristics in dedicated classes. In this way, the actual imaging tasks can remain generic, and the appropriate imaging class be selected with a mode parameter, e.g. VLASS quick look, ALMA 7m, etc. See Figure 5 for a sample VLASS image cutout.
VII. Summary
Over the past year, there have been three official pipeline releases: one Cycle 4 patch release which included new image size mitigation heuristics required for ALMA long baseline observations support, and two Cycle 5 development releases for user testing. The pipeline team is participating in the current end-to-end testing of the Cycle 5 pipeline software, which will support ALMA Cycle 5 observing and standard VLA pipeline calibration operations for the next year, and the first official VLASS observing run. An ALMA Cycle 5 patch, which will provide end-to-end HPC support for the ALMA pipelines, is targeted for later this year. Planning for Cycle 6 development is well underway, but final prioritization of both science and framework development targets is not yet complete.
ALMA & NRAO Help Desks
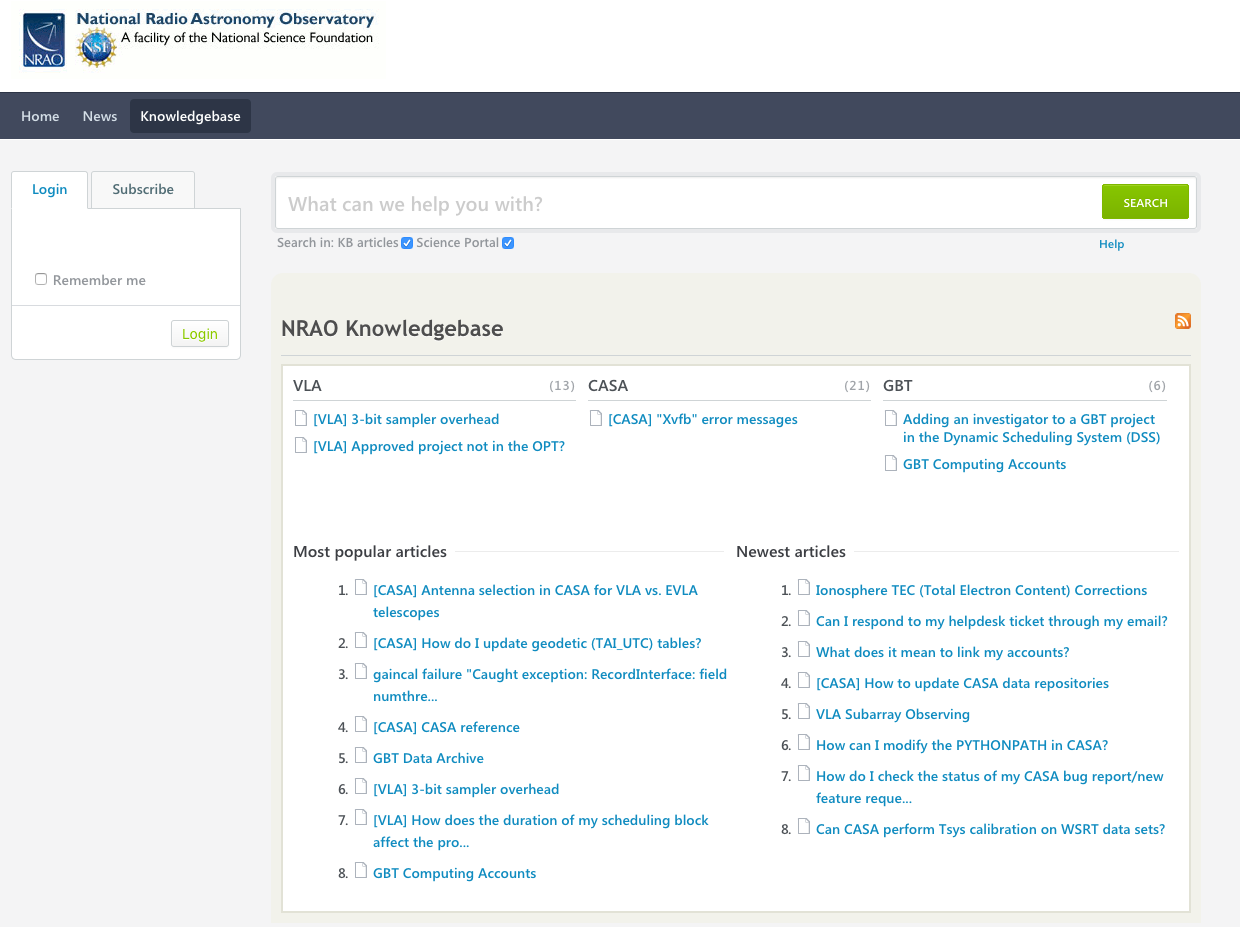
NRAO Help Desk
[click to enlarge]
ALMA Help Desk
[click to enlarge]
If you visit help.nrao.edu or help.almascience.org, you will find that there have been a few changes to our Help Desk systems.
The upgrade to our Help Desk software provided by Kayako has brought a much cleaner and modern look into our lives. You may also find that when you create or reply to a ticket through the webpage, there are new formatting options you may use for your text. With these formatting options we have enabled the Help Desk to send out html email notifications. Your email notifications should reflect any formatting used. Please, if you see any issues with our new page or with the notifications, let us know in a Help Desk ticket.
We would like to take a moment to remind users of the Knowledgebase page on the Help Desk. The Knowledgebase is a collection of articles written by staff members based on either issues we want to give you more information on, or based on frequently asked questions to the Help Desk. The NRAO Help Desk now also displays articles from the ALMA Help Desk knowledgebase so that all the information is found in one location.
One feature of the Help Desk that has always been available but is now improved is the search of the Knowledgebase articles while you fill out a new ticket submission form. While typing the body of your message, results should appear just under the box, showing results from the NRAO Knowledgebase and CASA articles from the ALMA Help Desk which might relate to your issue. Please take a look at the results before hitting the Submit button at the bottom of the page.
Lastly, we would like to remind users of the new reply via email feature of the Help Desk. Please make sure that the email you reply from is the same email used in your Help Desk and to not modify the subject of the notification email. The Help Desk needs the emails to match so that it knows which user responded, and new tickets cannot be created via email, so if the subject has changed and the Help Desk cannot find the ticket you are replying to, the email will bounce back to you and staff will not see your reply. For more information, please view the Knowledgebase article Can I respond to my helpdesk ticket through my email?
Radio-astro-tools

Radio-astro-tools is a suite of python packages intended to enable analysis of radio and millimeter data, though it also contains tools applicable at other wavelengths. The toolkit was initiated as part of an ALMA development study and has been maintained since then with volunteer effort. All of the tools are based on astropy and extend its functionality.
The suite, hosted at github.com/radio-astro-tools, is intended to be a central location for open-source radio astronomy tools. Anyone may contribute code to be included in this github organization.
There are several packages included in the suite, as described below.
spectral-cube is a library for handling spectral data cubes, i.e., those with two spatial and one spectral axis. The code is written to be efficient at handling large cubes, using memory mapping so that operations that do not require the whole cube in memory can be performed. For example, it is possible to load arbitrarily large – we have tested up to several hundred GB – cubes and extract subsets of those cubes for further analysis. spectral-cube makes conversion between frequency, wavelength, and velocity straightforward. It uses memory tricks to make certain types of masking efficient. It can read FITS data cubes, CASA .image files (from within CASA), and GILDAS-CLASS LMV files.
pvextractor is a tool to extract position-velocity diagrams from cubes along arbitrary paths. It contains two methods for extracting PV diagrams: direct interpolation, which uses the spectrum nearest the point along your specified path, and spatial averaging, which averages over a specified width perpendicular to the path. There are several GUIs associated with pvextractor, one that is built in and uses Qt, one that uses ds9's analysis tools, and one included in the Glue visualization package.
radio beam is a simple tool for representing beam information in python and parsing beam information from FITS files. It is primarily meant as a support tool for spectral-cube, but it can be used independently. It reads beam information from headers (including AIPS headers) and converts them to astropy Quantities, which allows for easy unit conversion, including Jansky-to-Kelvin conversion factors. In combination with spectral-cube, this tool can also be used to read the relatively new array-of-beams generated in CASA tclean-produced images.
statcont is a tool for determining the continuum in spectrally crowded data cubes and spectra. It uses a sigma-clipping approach to identify the continuum when there are no clearly identifiable continuum channels. More details can be found online at or in this paper.
uvcombine is a work-in-progress toolkit for single-dish / interferometer combination that is not yet ready for users. It provides a complete implementation of the "feather" approach identical to that in CASA, but with a few added parameters. It may be useful for those interested in understanding the limitations of feathering.
There are several other tools also in preparation, and user contribution is always welcome.
Cube Analysis and Rendering Tool for Astronomy
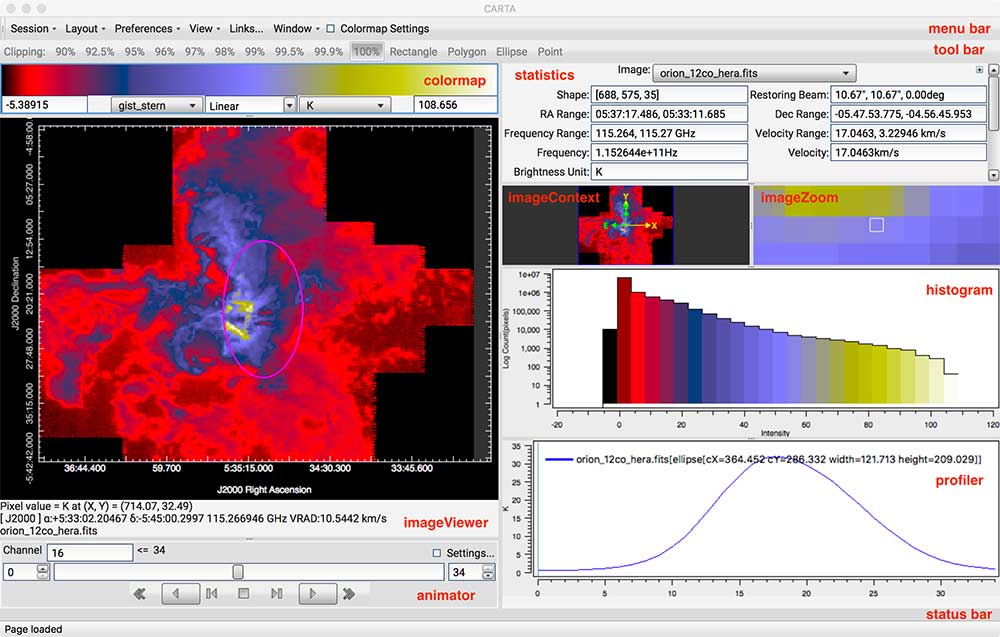
[click to enlarge]
The Cube Analysis and Rendering Tool for Astronomy (CARTA) is being developed by a team consisting of the members from Academia Sinica Institute of Astronomy and Astrophysics (ASIAA), National Radio Astronomy Observatory (NRAO), University of Alberta, and Inter-University Institute for Data Intensive Astronomy (IDIA). After an internal review of the CARTA project in June 2017 at NRAO – Socorro, the CARTA team decided to revise the overall architecture and graphical user interface (GUI) to satisfy the specification requirements and user needs. The new architecture will strengthen the shared screen (session) capability for collaborative work, provide good performance for very large image cubes, implement the command line interface in python under the server-client scheme, and equip other useful image analysis tools. The new GUI will provide an enhanced layout for image viewing and analysis. Work on the implementation of the new architecture and GUI has started, and the transition phase is expected to last ~ 12 months.
For the current preview version (v0.9), which is released along with this CASA News issue, the CARTA team has focused on performance, stability, and major bug fixes. The preview version includes basic image viewing capability, a basic statistical analysis tool, and a basic spectral line analysis tool.
For the new architecture version, the existing functionalities in the preview version will be migrated gradually. New features, such as channel maps, interactive position-velocity maps, moment maps, and volume rendering, etc., will be implemented in the new version only. The CARTA team expects it to take 18-24 months in order to fully implement the new architecture and include the new features.
For more information on the current and future features, please view the user manual. Interested developers are welcome to visit the CARTA GitHub. Comments, suggestions, and feature requests are more than welcome!
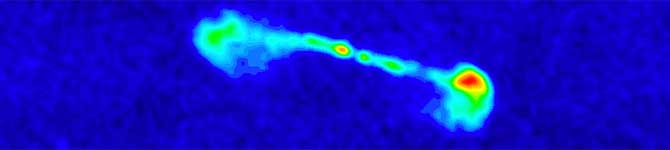
Featured Image: CASA Images the Sun
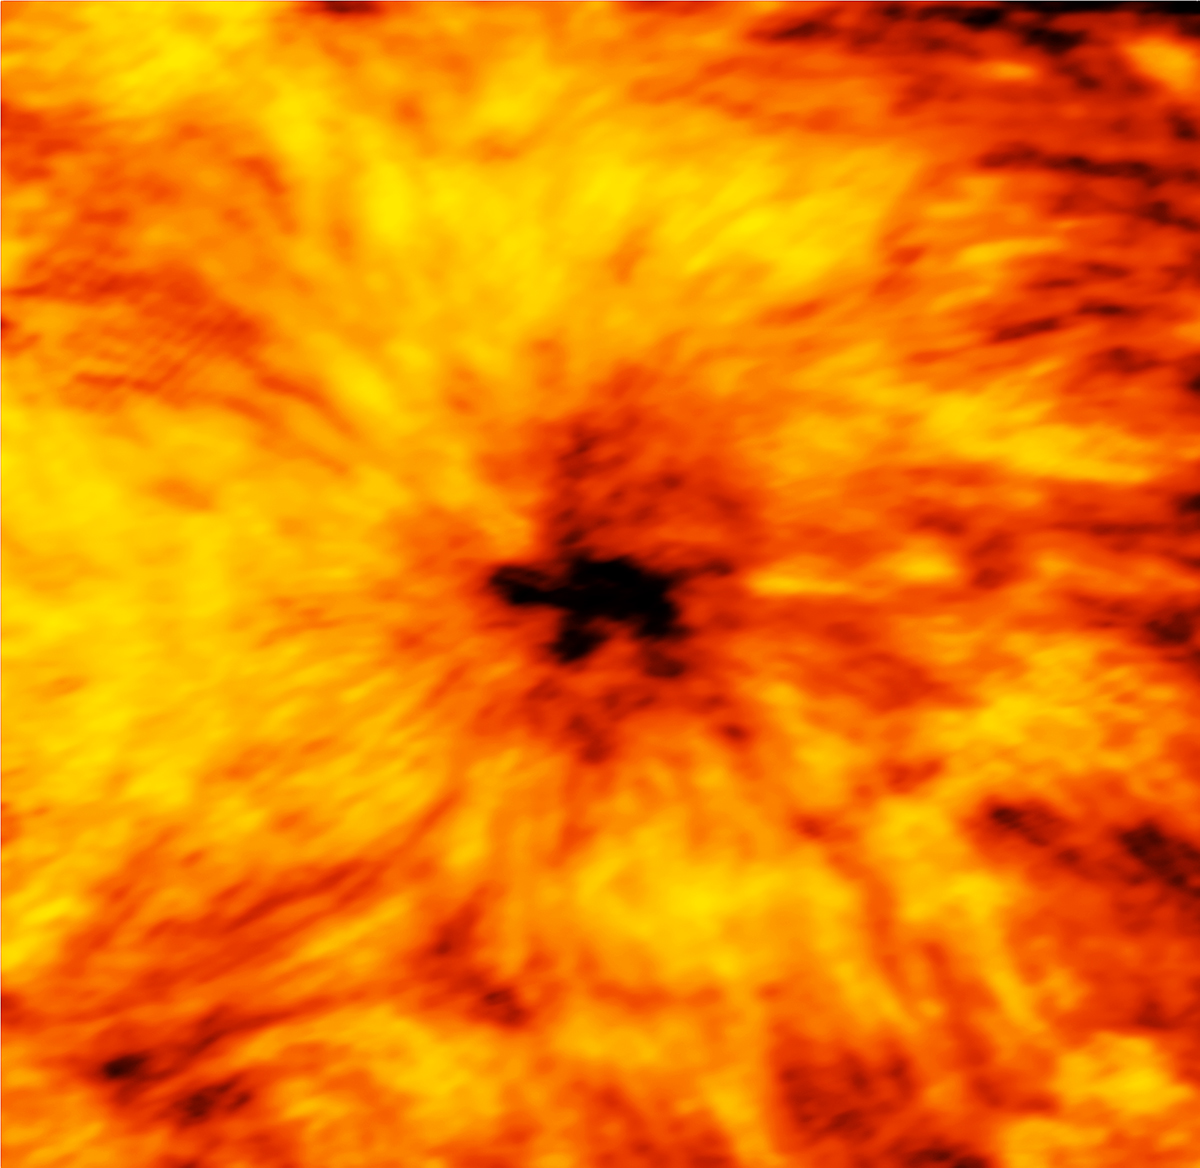
ALMA (ESO/NAOJ/NRAO)
ALMA image of the Sun’s chromosphere, showing an enormous sunspot. The image was taken on 18 December 2015 with the Band 6 receiver at a wavelength of 1.25 millimeters, and reduced using the CASA software.
[click to enlarge]
A new image taken with ALMA and reduced with CASA reveals stunning details of our Sun, including an evolving sunspot that is nearly twice the diameter of the Earth. This image was taken as part of ALMA’s solar commissioning campaign. It captures the millimeter-wavelength light emitted by the Sun’s chromosphere — the region that lies just above the photosphere, the visible surface of the Sun.
The Sun is much brighter and larger than the distant objects that ALMA typically observes. Therefore, the solar commissioning team not only had to develop special procedures to enable ALMA to safely image the Sun, but also faced challenges in terms of data reduction in CASA. The Sun has a complex structure with a wide range of spatial frequencies, and is dynamic on time-scales of less than a minute. The image above was made using a 149-pointing mosaic, using a heterogeneous array that simultaneously includes the most compact 12m array, as well as the 7m and total-power antennas.
The team showed that CASA can handle solar data obtained with a heterogeneous array, even when the 12m and 7m array are jointly calibrated. The faint, fine stripes that are visible in the image are artifacts introduced by the relatively long (> 200m) baselines between antennas from the 12m and 7m arrays, which are centered at a different location on the Chajnantor plateau.
Masumi Shimojo from the National Astronomical Observatory of Japan adds: “When we use CASA’s clean task for synthesizing a solar image, the mosaic option for the imagemode parameter has to be used even for the data of single-pointing observations, to deal with the heterogeneous-array nature of the data. For mosaic observations, we have to re-calculate the coordinate of each pointing, because the heliocentric coordinate frame is moving relative to RA and DEC during an observation.” Other data-reduction challenges include tuning the feather task in CASA to combine the single dish and interferometer data, and accurately measuring and applying the antenna temperatures to determine absolute brightness temperatures.
References:
(1) M. Shimojo, T. Bastian, A. Hales, et al., Solar Physics, 292, 87.
(2) NRAO press release 17 Jan 2017.
The ‘MS transition’ of Single Dish tasks
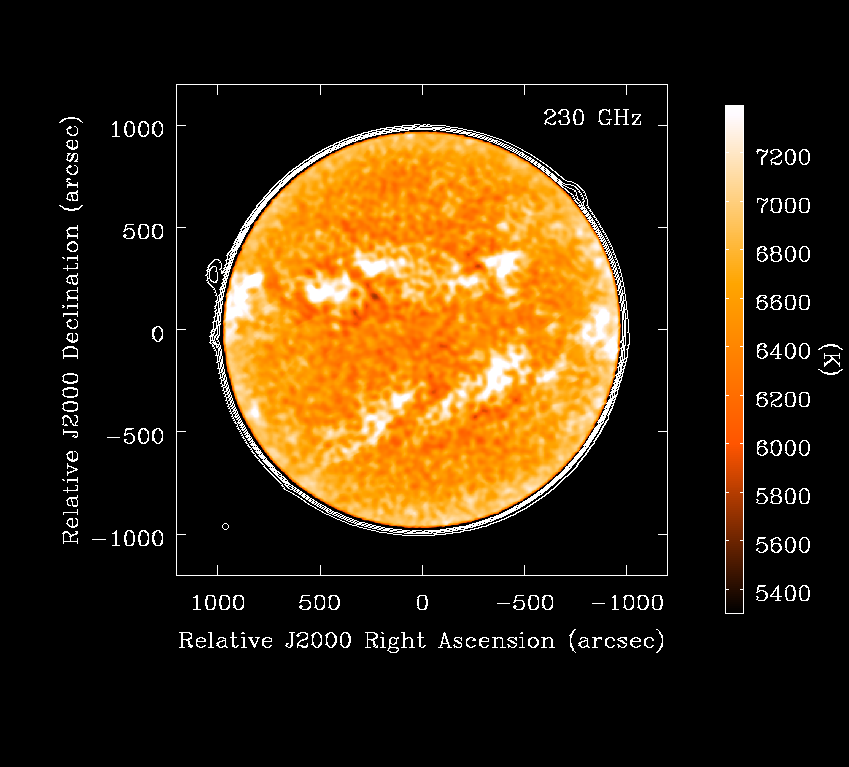
Figure 1: Single-dish Sun observations with ALMA total-power antennas in Band 6, processed with the new MS-based single dish tasks (White et al. 2017). Color scale 5300-7400K, contours at 300, 600,1200, 2400K.
[click to enlarge]
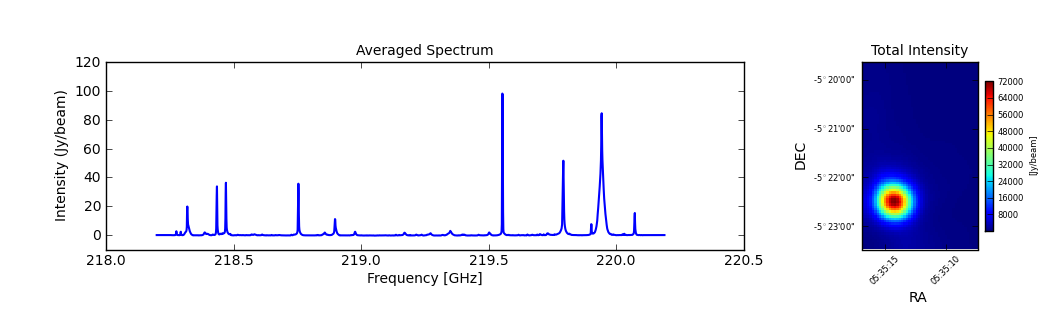
Figure 2: Spectrum & integrated intensity map of an Orion Molecular Core 1 outflow. Re-processed from ALMA project 2013.1.00546 (PI: J. Bally).
[click to enlarge]
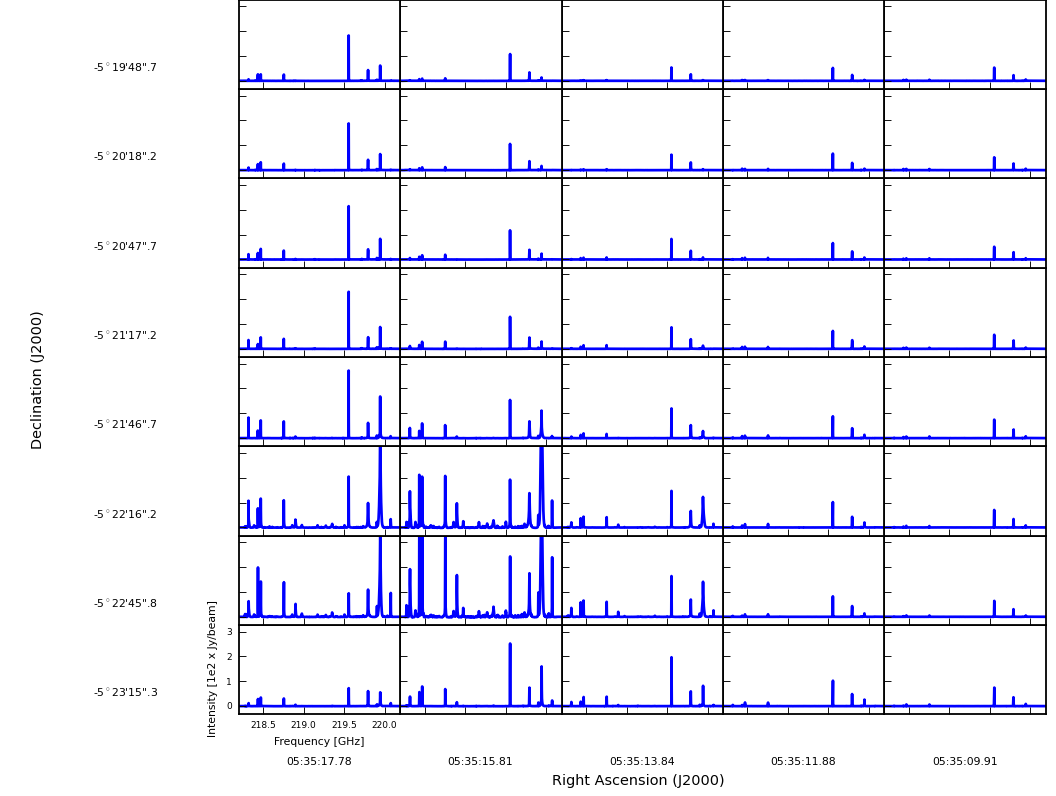
Figure 3: Line profile maps, Orion Molecular Core 1 region in Fig. 2.
[click to enlarge]
The CASA Single Dish team is pleased to report that single dish (SD) tasks now work completely on the Measurement Set (MS). The new SD tasks became the defaults in the CASA 5.0 release, and, finally, traditional SD tasks and the Australian Telescope National Facility Spectral Analysis Package (ASAP) are retired in CASA 5.1 release.
Since SD tasks were first implemented in CASA, calibration functionality had depended on ASAP and was based on the Scantable data format (see CASA News Issue 1 for the history of Single Dish package in CASA). In summer 2014, it was decided SD tasks in CASA shall be re-implemented to work directly on the MS as the other CASA tasks do. The activity is called the ‘MS transition’ project.
The advantages of using the MS throughout CASA are: (1) it avoids potential confusion and reduces learning costs of users due to having two data formats, the MS and Scantable; (2) it allows reuse of existing infrastructure and tasks and contribute to efficient development and maintenance of software; and (3) it allows a more common look and feel throughout the package. Since the CASA 4.4 development period, SD team has worked on MS transition taking advantage of Sakura library, a high-performance array-operation library developed at NAOJ.
The primary goal of the MS transition is to migrate all SD functionality necessary to support the Atacama Large Millimeter/submillimeter Array (ALMA), Nobeyama 45-m telescope (NRO 45m), and Atacama Submillimeter Telescope Experiment (ASTE). Note that this requires migration of ALMA SD pipeline, too. To support smooth migration, tasks, parameter names, and syntax are kept unchanged in new SD tasks, wherever possible. In addition, a new task, importasap, is provided to convert a Scantable to MS to support use of existing Scantables. Note, however, some of the SD tasks are replaced by existing CASA tasks. We also took this chance to decommission a few tasks and parameters that do not fit into operations on MS and/or that have limited capability and are rarely used. Details of correspondence between new and old SD tasks are described in the table below.
As of CASA 5.1 release, most of the functionality in SD tasks is migrated to new tasks with a few exceptions mainly in plotting capabilities. The new SD tasks are verified using observational data taken by ALMA and NRO 45m. The MS transition of the ALMA SD pipeline was complete in CASA 4.7 release and the new pipeline has been in operation since the start of ALMA Cycle 4. The other reduction scripts used in ALMA have been updated using the new SD tasks and will be in operation in Cycle 5. For users who would like to update their script, a CASA guide using M100 Band 3 observational data is available for CASA 5.1 release.
In future releases, CASA SD team will work on the migration of the rest of the functionalities, e.g., some of the plotting capabilities and sideband separation algorithm, and on improvement of performance in the new SD tasks. Unfortunately, a part of new SD tasks is slower than old, ASAP SD tasks. This is mainly because data access methods in common CASA infrastructure codes are not optimized for SD data while ASAP ones were. The team will speed up those tasks in coming releases by utilizing experiences in optimization of ASAP.
References
Bally 2016, ARA&A, 54, 491.
Bally et al. 2017, ApJ, 837, 60.
White et al. 2017, Solar Physics, 292, 88.
Acknowledgement
The CASA SD team appreciates Malte Marquarding and his ASAP team in Commonwealth Scientific and Industrial Research Organization for long years of collaboration and cooperation.
Table-1: Correspondence of ASAP SD tasks and new SD tasks
| ASAP task | New SD task |
|---|---|
sdaverage (smoothing) |
sdsmooth |
sdbaseline |
sdbaseline |
sdcal, sdcal2 |
sdcal |
sdfit |
sdfit |
sdsave |
importasap, importnro |
Table-2: Correspondence of ASAP SD tasks and alternative CASA tasks
| ASAP task | Alternative CASA task |
|---|---|
sdaverage (averaging) |
mstransform |
sdcoadd |
concat |
sdflag |
flagdata, flagcmd, plotms, viewer |
sdflagmanager |
flagmanager |
sdlist |
listobs |
sdplot |
plotms, msview |
sdscale |
gencal + applycal |
sdstat |
visstat2 |
Table 3: Decommissioned SD tasks
| Decommissioned SD tasks | |
|---|---|
sdgrid |
sdmath |
sdreduce |
sdtpimaging |
VLA Tropospheric Delay Error Correction in CASA
During the period 9 August 2016 to 14 November 2016, the VLA online system was incorrectly compensating for the elevation-dependent tropospheric delay. In general, the dominant effect of this error is to introduce a net systematic astrometry error in the elevation direction that is proportional to the difference in the online tropospheric delay model between target source and complex gain calibrator (and thus also proportional to the separation of target and calibrator in the elevation direction). Since the relevant geometry is a function of time, a significant degree of smearing may occur for longer observations. The detrimental effect of this error is greatest at low elevation (e < ~ 20 deg) and for the highest-angular resolution observations (high frequency, large array), i.e., when the scale of the astrometry error becomes significant compared to the synthesized beam, and is mainly relevant where accurate relative astrometry is important (e.g., registration of multi-epoch observations, or with images from other observatories). The detailed circumstances of the online tropospheric modeling error and a complete quantitative description of its effects can be read online.
An essentially automatic offline processing repair for this issue was introduced in the CASA 4.7.1 patch release, and will remain in effect for all subsequent CASA releases. Since the online error is effectively just a time-dependent antenna-based delay error, it is very natural and straightforward to include a correction for it as part of the antenna-position error correction code. Antenna position errors arise when recently moved antennas participate in standard science observing using nominal geographic coordinates for their positions, and before revised positions are determined and incorporated in the online system. In a manner very similar to the troposphere delay error, an antenna position error (typically of order ~1cm) causes a delay error proportional to the projection of the position error along the time-dependent observing line-of-sight. And like the troposphere delay error, the effective antenna position error effect is slightly different between calibrator and target fields, and so cannot be accurately corrected by standard calibration transfer. Both errors are geometry-dependent line-of-sight path length errors generating a time-dependent delay error in the visibilities.
So, for VLA observations occurring within the relevant date range, CASA is now (v4.7.1 and later) conditioned to implicitly include the nominal geometry-dependent troposphere delay error correction (as described at the link provided above) along with the antenna position delay corrections, via the gencal task (caltype='antpos'), even when there are no non-trivial antenna position errors to correct for (it is therefore important to invoke gencal with caltype='antpos', even if no antenna position errors exist). Note that the antenna position correction caltable contains only the antenna-based position offsets from which the corresponding delay corrections are calculated on-the-fly when applied to data; the tropospheric delay corrections are also calculated on-the-fly. The tropospheric delay error is also a mild function of macroscopic weather conditions (e.g., temperature, pressure), but no attempt is made to track the weather-dependence, as this has been deemed negligible for most observations. The nominal physical scale (the constant, k = 1e-6, as described at the above link) is assumed sufficiently accurate. When relevant, log messages occur that indicate unambiguously that the troposphere delay corrections are being included, and they include the physical scale factor adopted. The VLA Calibration Pipeline will also automatically include this correction. Non-VLA datasets (e.g., ALMA), entirely ignore it. VLA observers and CASA users concerned about this issue are welcome to contact the NRAO Helpdesk for more information and advice.
CASA Calendar
Dates |
Event |
Location |
|---|---|---|
1 Oct 2017 |
n/a |
|
2 - 6 Oct 2017 |
JIVE – Dwingeloo, Netherlands |
|
16 - 20 Oct 2017 |
ASTRON – Dwingeloo, Netherlands |
|
23 - 27 Oct 2017 |
NRAO – Socorro, NM, USA |
|
25 - 27 Oct 2017 |
ESO – Garching, Germany |
|
8-9 Nov 2017 |
NRAO – Charlottesville, VA, USA |
|
26 - 27 Dec 2017 |
2017 ALMA/45m/ASTE Users Meeting (includes CASA tutorial session) |
NAOJ – Mitaka, Japan |
01 Feb 2018 |
n/a |