
CASA News
Issue Iss#
Day# Month# Year#

CASA News
Issue Iss# • Day# Month# Year#

Letter from the Lead
We are pleased to share with the community several updates on long-running development items as part of this mid-cycle communication. Version 5.5 of the Common Astronomy Software Applications (CASA) package brings with it several updates to calibration and imaging tasks, along with a revised look and feel to our online documentation. Parallel tclean via mpicasa is now the recommended approach for imaging. We are now able to share with the community the results of our telemetry recording previously announced as part of CASA 5.4. Finally, CASA 6 is nearly ready for release with preview pip wheels now available for beta users.
Many of you have seen the statement issued by the Atacama Large Millimeter/submillimeter Array (ALMA) on Cycle 5 mosiac issues and re-processing of some datasets. We wish to share a frank summary from the software development side of these recent challenges encountered with mosaic imaging and how we are working to improve the quality of our verification testing.
The initial release of the Cube Analysis and Rendering Tool for Astronomy (CARTA) was completed last December with a follow-on release scheduled for the near future and incremental development of major new functionality defined for the remainder of the year.
The CASA team would like to congratulate the Event Horizon Telescope (EHT) collaboration on their recently-reported spectacular M87 black hole imaging results. CASA is proud to have played a small but critical specific role in the verification of EHT calibration (The Event Horizon Telescope Collaboration et al. 2019, ApJL, 875, L3), mainly via Very Long Baseline Interferometry (VLBI) specific capabilities recently added to CASA in a collaboration spearheaded by our colleagues at the Joint Institute for VLBI (JIVE), an European Research Infrastructure Consortium (CASA Newsletter #6), and within the general-purpose VLBI Radboud Pipeline for the Calibration of high Angular Resolution Data (rPICARD) developed using CASA by Michael Janssen. We appreciate JIVEs continuing investment in CASA, and expect to continue and broaden support for general VLBI processing in the coming years.
Lastly, we are currently looking for qualified Software Engineers to join the CASA development team at NRAO. These positions are located in the USA at either the Very Large Array (VLA) – Array Operations Center in Socorro, New Mexico, or NRAO headquarters (North American ALMA Science Center) in Charlottesville, Virginia.
CASA 5.5. Release
We have made a large number of exciting improvements to CASA in version 5.5. Given their novelty, we still consider the major new developments as experimental, but they are available to all users, and we welcome feedback.
For example, we established and streamlined the polarization calibration scheme for linear feeds. This development will mainly be used by ALMA, but we are also commissioning the procedures for Very Large Array (VLA) P-band frequencies at this time. Another calibration improvement is the introduction of robust and linear solvers in gaincal. We also added new weighting options to tclean, including a normalized Briggs scheme, briggsabs, and options for cube imaging to either use visibilities per plane or per cube for the image weights. To help estimating the expected image sensitivity based on visibility weights and some imaging parameters, we introduce the new task apparentsens. This task provides a good estimate of the expected thermal noise that can be used for threshold cleaning and to estimate the magnitude of any remnant systematic imaging errors.
These are just a few highlights of the CASA 5.5 release and we have made significant improvements to many other tasks such as plotms, importfitsidi, statwt, immath, as well as introduced a new single dish task sdpolaverage, to name but a few. As always, a full list of improvements is provided in the Release Notes on CASA Docs.
We also improved the CASA Docs documentation website with a more modern look and layout. This will hopefully enhance user experience while we continue to improve the CASA documentation.
Warning! We are starting to decommission the clean task. Although clean is still available in CASA 5.5, we urge all users to switch to tclean if they have not yet done so. Please contact the helpdesk if you need any help with the transition.
This is a general CASA release. ALMA and VLA pipelines are not included as updates to the pipelines are scheduled for the fall when new telescope observing cycles start.
CARTA Development Update
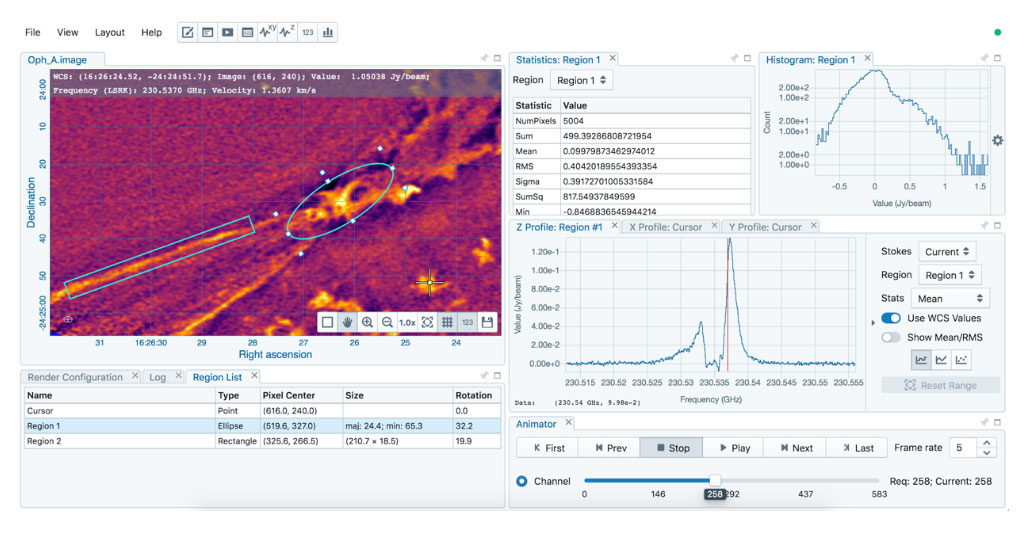
Screenshot of v1.1 release showing the Region of Interest (ROI) feature.
[click to enlarge]
The Cube Analysis and Rendering Tool for Astronomy (CARTA) is a new image visualization and analysis tool designed for ALMA, the VLA and the Square Kilometre Array (SKA) pathfinder telescopes. CARTA is developed by a consortium of the Academia Sinica Institute of Astronomy and Astrophysics (ASIAA), the South African Inter-University Institute for Data Intensive Astronomy (IDIA), the National Radio Astronomy Observatory (NRAO), and the Department of Physics, University of Alberta.
New CARTA v.1.1 Release
The CARTA development team is excited to announce that the CARTA v1.1 release is now ready to download for the community! The packages can be retrieved from the CARTA website. The user manual, installation and configuration guide, as well as a quick guide on how to interact with the CARTA graphical user interface are available.
Key features in this release are:
- Initial support for regions of interest (demo; user manual)
- Region statistics, histogram, and spectral profiler
- Initial support of the HDF5-IDIA image format (significant performance advantages over FITS files when generating channel and cube histograms, and reading cursor spectral profiles)
- Basic server-side authentication
- Command line startup and improved “remote” mode (user manual)
- Performance improvements, reduced memory usage and bug fixes
There are some known issues which the CARTA development team has planned to solve in the future releases.
Should there be any issues, please contact the CARTA helpdesk. Also check out this demonstration video, showing a CARTA development version that includes the Region of Interest feature.
2019 Release Roadmap
This roadmap is subject to change, depending on development progress. Four releases of CARTA software are planned for 2019. Between these releases, it is expected that there will be a few minor patches to fix particular bugs. The major new features associated with each of the releases are listed below. If you have any comments about these features, please email the CARTA Helpdesk.
v1.2: performance and usability improvement (mid 2019)
- ROI: polygon and point
- ROI: import/export
- tiled rendering
- profile delivery optimization
- performance improvement
- usability improvement
- server support improvement
v1.3: WCS group (Q3 2019)
- WCS group, alignment of multiple images
- contour rendering
- ROI in WCS group
v1.4: Scripting interface and image analytics tools (Q4 2019)
- multi-panel image view
- image analytics tools
- scripting interface
v1.5: Interactive clean (Q4 2019/Q1 2020)
CASA Parallel Processing & Performance
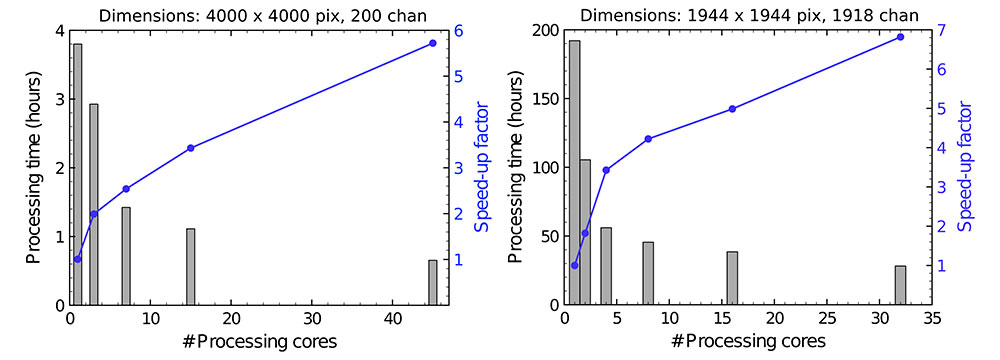
Fig. 1: Parallel processing in tclean for two mosaic data sets, using the multi-core Lustre file system of the North American ALMA Science Center.
[click to enlarge]
CASA provides a framework to run tasks and commands in parallel using multiple cores and multiple computing nodes such as a cluster. The CASA Parallelisation framework is implemented using the Message Passing Interface (MPI) standard. The CASA distribution comes with a wrapper of the MPI executor called "mpicasa", which does several things behind the scenes to properly configure the environment to run CASA in parallel.
For most data sets, imaging and deconvolution are the most demanding in terms of run time, therefore they will greatly profit from the parallel processing provided by CASA. tclean is the primary CASA task used for imaging and deconvolution. tclean is the successor of clean, which is no longer being actively maintained. For the first time, the ALMA imaging pipeline [1] has the parallel processing mode of tclean enabled during Cycle 6 (CASA 5.4.0), achieving substantial performance improvement (Fig. 1). This is done through MPI, which speeds up various components of tclean, including gridding, deconvolution, and auto-masking. This parallel mode can be triggered in the mpicasa environment using the parameter parallel = True on normal MeasurementSet data. We are confident that this mode utilized by the ALMA imaging pipeline is mature and suitable for general use on most data sets.
Several calibration tasks can be executed in parallel with the use of an embarrassingly parallel approach that partitions the MeasurementSet (MS) into multiple Sub-MSs. The resulting partitioned MS is called Multi-MS or MMS. Logically, a Multi-MS has the same structure as a normal MS, but internally it is a group of several MSs, which are virtually concatenated. The Multi-MS approach is experimental but it is available to use in the latest CASA release. Please, report any issues with MMS to the CASA helpdesk.
For more information on parallel processing in CASA, see CASA Docs, the information provided in Castro et al. (2017) [2], and CASA Memos 4 & 5.
References
[1] Muders et al. 2014, ASPC, 485, 383.
[2] Castro et al. 2017, ASPC, 512, 595.
Telemetry Recording
With the release of CASA 5.4.1 last year, telemetry reporting has been active and the development team has been receiving and compiling data on real world CASA usage. As described in the previous CASA newsletter, telemetry reports are anonymous usage statistics of task-level execution, timings, and OS environment. The goal is to better understand CASA usage patterns and elicit relative quality metrics to further improve CASA functionality while still protecting the privacy of our user base and science.
As it has now been ~ five months since the release of 5.4.1, we have compiled the initial telemetry summary report for release to the community. The following tables depict most/least CASA task usage from 8 Dec 2018 – 1 Apr 2019. The full table is online.
Task |
Unique Users |
Total Executions |
Mean Time (s) |
Median Time (s) |
Max Time (s) |
|---|---|---|---|---|---|
listobs |
293 |
14,388 |
143 |
4 |
349,366 |
tclean |
259 |
98,263 |
48,376 |
224 |
2,109,388 |
viewer |
259 |
5,886 |
12,431 |
3 |
1,249,971 |
plotms |
254 |
83,843 |
436 |
10 |
517,319 |
split |
232 |
10,468 |
792 |
30 |
446,971 |
exportfits |
193 |
22,821 |
24,322 |
157 |
2,927,080 |
applycal |
154 |
5,049 |
16,789 |
99 |
599,258 |
flagdata |
154 |
16,132 |
1,193 |
73 |
521,793 |
gaincal |
147 |
12,494 |
5,894 |
124 |
587,843 |
gencal |
138 |
7,979 |
1,394 |
14 |
433,708 |
plotweather |
114 |
1,821 |
3,072 |
7 |
433,725 |
flagmanager |
110 |
2,739 |
3,347 |
11 |
589,380 |
statwt |
109 |
1,840 |
2,155 |
901 |
272,374 |
importasdm |
108 |
2,319 |
1,918 |
401 |
251,268 |
setjy |
107 |
12,465 |
9,299 |
104 |
593,097 |
exportasdm |
2 |
15 |
4 |
1 |
30 |
importgmrt |
2 |
6 |
39 |
40 |
51 |
listcal |
2 |
2 |
416 |
416 |
830 |
listpartition |
2 |
16 |
2 |
1 |
17 |
widebandpbcor |
2 |
2 |
23 |
23 |
37 |
calstat |
1 |
1 |
1 |
1 |
1 |
clearstat |
1 |
1 |
1 |
1 |
1 |
importatca |
1 |
3 |
62 |
62 |
63 |
oldsplit |
1 |
12 |
1 |
1 |
1 |
predictcomp |
1 |
2 |
1 |
1 |
1 |
sdsidebandsplit |
1 |
15 |
1 |
1 |
3 |
slsearch |
1 |
3 |
1 |
1 |
1 |
splattotable |
1 |
1 |
1 |
1 |
1 |
spxfit |
1 |
2 |
2 |
2 |
2 |
testconcat |
1 |
1 |
1 |
1 |
1 |
uvcontsub3 |
1 |
1 |
1 |
1 |
1 |
From this data, we can clearly see which tasks are executed the most (and least) both in terms of number of users and total number of times. We also get a sense of which tasks are taking the longest to complete on user machines. Note that some tasks may never have been executed, and thus not show up in the data at all.
The following chart depicts usage of the 5.4.1 release over time (release date was 8 Dec 2018). See if you can spot the weekends.
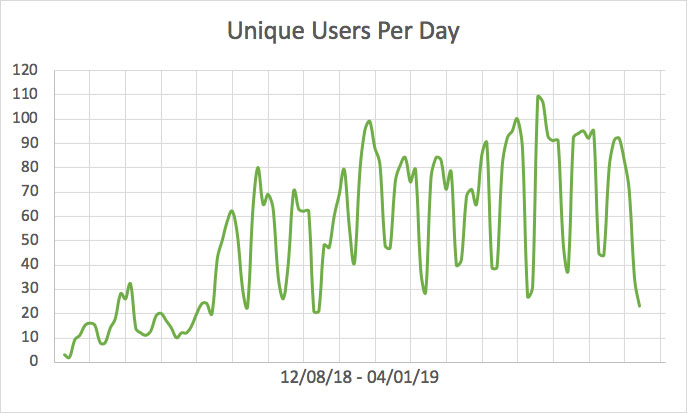
Lastly, we have usage by operating system in the following table.
OS |
Unique Users |
Total Executions |
|---|---|---|
RedHat 6 |
118 |
172,719 |
RedHat 7 |
77 |
114,123 |
Centos 6 |
17 |
93,556 |
Centos 7 |
83 |
60,192 |
Debian |
128 |
571,823 |
Darwin 16 |
26 |
3,242 |
Darwin 17 |
70 |
53,894 |
Darwin 18 |
67 |
110,948 |
Fedora |
10 |
10,174 |
All |
607 |
1,215,790 |
There are a number of caveats that come with this data. It is limited to version 5.4.1 and does not capture the entire user base, given that some percentage of people will inevitably turn it off (or run offline with no internet). The “unique users” count is estimated from a hash of the machine MAC address(es) and thus we cannot distinguish multiple users on one machine, or the same user on multiple machines. Some operating systems and VMs may further obfuscate the MAC address leading to inconsistent user counts when comparing the OS table to the task execution table. Lastly, since the telemetry is batch reported for efficiency, users who only execute CASA a small number of times may never fill a batch to report, or there may be significant lag, i.e., we have not received it yet.
Nevertheless, the CASA team is excited to begin tracking this type of information. The reports are generated from a kibana interface over an elasticsearch engine, leading to flexible and dynamic reporting including trends over time and from release to release. We also plan to combine telemetry reports with the older crash reporter system to produce a reliability metric for CASA tasks.
Mosaic Imaging & Recent Bug Fixes
NAASC Software Support Team, NAASC memo 117
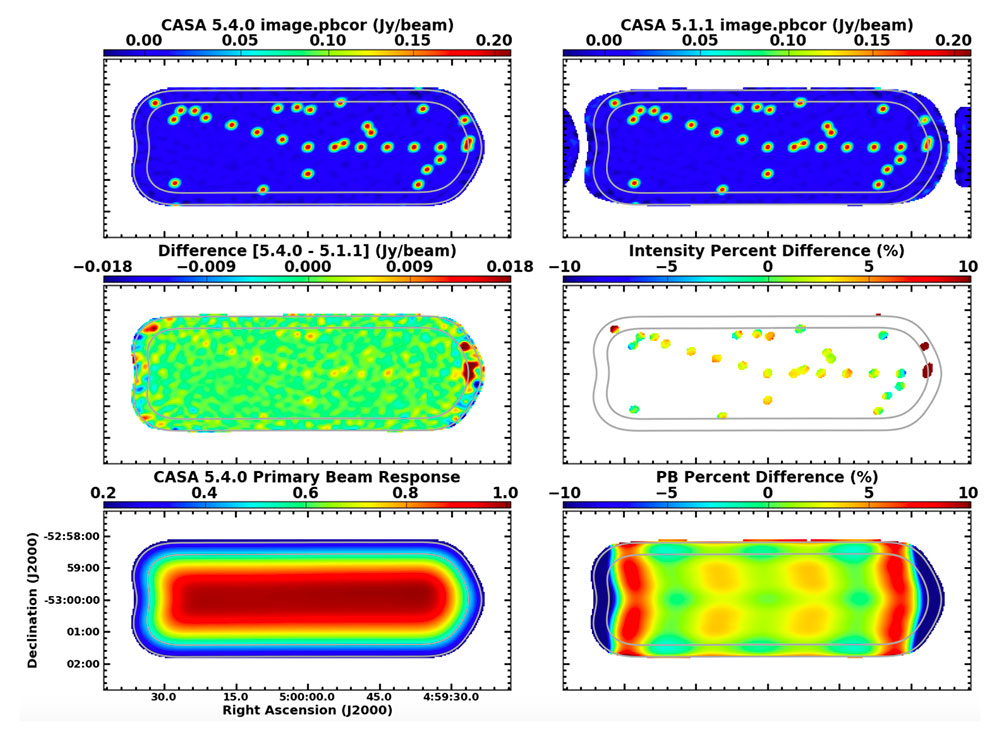
tclean images of a 7m array simulation with 11× 3 pointings, showing the problem with the truncated version of the PB model.
[click to enlarge]
Over the past development cycles, the CASA team, with help from ALMA and VLA scientists, has worked on resolving a number of issues that affected the imaging with the mosaic gridder in tclean.
As of CASA 5.0, a truncated version of the primary beam (PB) model was erroneously used for gridding the data in tclean. This truncation caused aliasing in all CASA mosaic images made with the mosaic gridder. Inside the 50% mosaic primary beam response, most mosaics were affected by flux errors at the level of a few percent, although in extreme cases errors as large as 15% were observed for ALMA. This issue was fixed in CASA 5.4 (ALMA Cycle 6).
In addition, in CASA versions 4.7 and below, a coding error caused ALMA 7m-array mosaic imaging to use a non-optimal definition for the antenna primary beam. For Nyquist-sampled mosaics, after primary beam correction, resulting ALMA 7m flux densities were too high by ~10% (~20%) within the 50% (20%) mosaic primary beam response.
These two issues were investigated and quantified for ALMA by the North American ALMA Science Center (NAASC) Software Support team, as can be read in this memo.
Another problem was that the signal-to-noise in the first pointing of a mosaic (typically a corner) could be noticeably lower than in the rest of the cube. The problem was that the first integration of the first field of each source was dropped whenever the parameter chanchunk utilized values > 1 for both gridder='mosaic' and gridder='standard’ in tclean. Only images with few integrations per field were adversely affected – typically large mosaics and very short snapshot observations. This was fixed for the CASA patches 5.4.0-70 (ALMA) and 5.4.1-32 (VLA), which are now used for the ALMA and VLA 5.4 pipelines.
Recognizing the effect of problems like these on our users, the CASA team is in the process of revising its test strategy to minimize unexpected behavior, as well as better marking features as experimental in CASA Docs. These efforts are also in line with the outcome of last year's CASA users survey, where the community requested to make CASA more reliable. This is a significant undertaking that will last several development cycles, but which will make CASA more robust against bugs in the future.
Detailed information on the above bugs can be found in the CASA 5.4 Release Notes in CASA Docs.
CASA 6: Modular Integration in Python
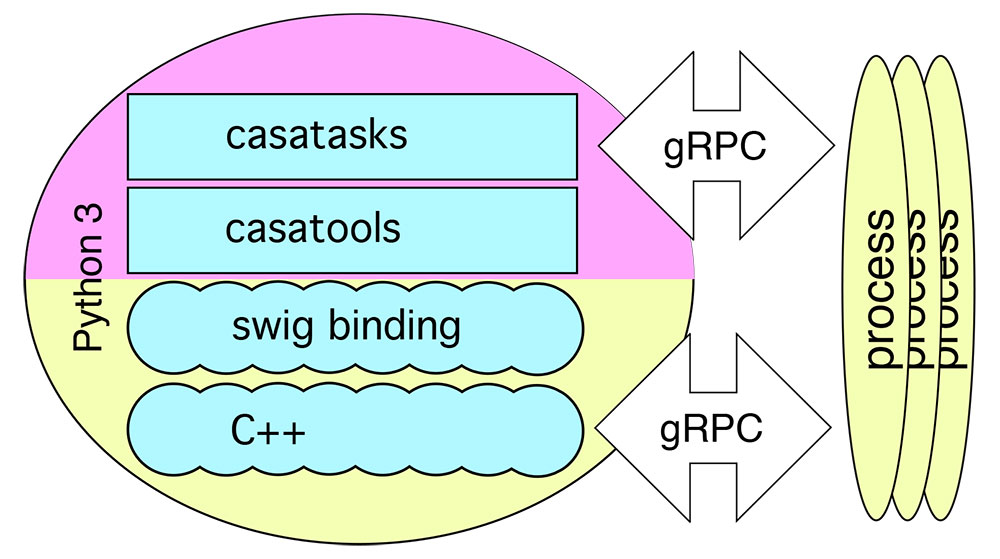
Schematic overview of processes in CASA 6.
[click to enlarge]
CASA has always been distributed as a single, integrated application, including a Python interpreter and all the libraries, packages and modules. As part of the ongoing development of CASA 6, and the switch from Python 2 to 3, CASA will provide greater flexibility for users to integrate CASA into existing Python workflows, with tools and tasks as standard Python modules.
From CASA 6 onward, CASA should really be thought of as the system described in Figure 1, comprising only the tools and tasks that CASA 5 currently provides. In addition, the plan is for important functionality like CARTA, the CASA viewer, and CASA plotms to be available as independent Python 3 modules (like casatools and casatasks). For example, the CASA viewer process would correspond to one of the "process" ellipses in the diagram. All of the other functionality will be preserved and will be available in an all-inclusive distribution, which also continues to serve users who are not interested in this new capability.
We plan to make the PIP wheels for casatools and casatasks available from casa-pip.nrao.edu by the publication date of this newsletter. casa-pip.nrao.edu will be a public PyPI server providing the Python 3 modules which CASA produces as PIP wheels. The casatools wheel is necessarily a binary wheel so there will likely be compatibility issues for some time as we work toward making wheels available for important Python configurations. Initially, we are targeting Python 3.6 as provided by RedHat for our wheel production, although we have had some success on other Linux-based platforms as well.
Users are welcome to try the new CASA 6 pip install to their own python environment. This is roughly analogous to using the current pre-release builds of CASA 5.x as it is coming from the unreleased master branch of the repository. Instructions are as follows (from a RHEL7 terminal window):
- python3 -m venv casa6beta
- source casa6beta/bin/activate
- pip install --extra-index-url https://casa-pip.nrao.edu:443/repository/pypi-group/simple casatools
- pip install --extra-index-url https://casa-pip.nrao.edu:443/repository/pypi-group/simple casatasks
- #sanity check
python
import casatasks as ct
help(ct)
exit() - deactivate
Note that you need python 3.6 installed and may also need libgfortran3. The use of python3 venv is a simple built-in method of containerizing the pip install such that multiple versions of CASA 6.x can be kept on a single machine in different environments.
The first official release of CASA 6, including an all inclusive environment with python in a tar file, is planned for July 2019. This will be based on the same science and functionality as the upcoming CASA 5.6 to be used in ALMA Cycle 7 processing.
Cannonball Pulsar: the Kick in CASA imaging
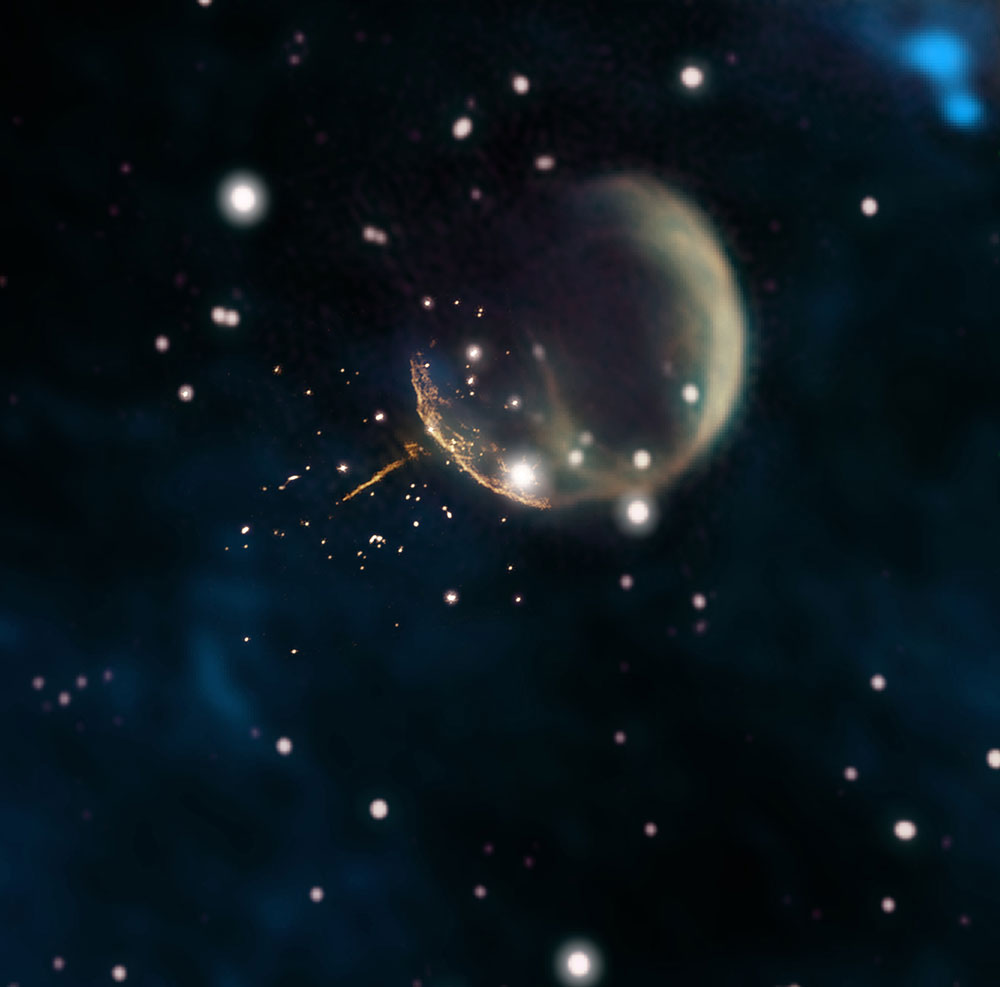
Composite by Jayanne English, University of Manitoba; F. Schinzel et al.; NRAO/AUI/NSF; DRAO/Canadian Galactic Plane Survey; and NASA/IRAS.
The Cannonball Pulsar. The high-resolution VLA image in the center is overlaid with a low-resolution panoramic view of the supernova remnant.
[click to enlarge]
Using the Karl G. Jansky Very Large Array (VLA) and CASA, a team of astronomers has imaged a pulsar, designated PSR J0002+6216, speeding away from its presumed birthplace in a giant supernova remnant. The kick that this pulsar received from the supernova explosion, likely as a result of hydrodynamic instabilities in the supernova explosion, created a long trail of shocked particles and magnetic energy that stretches far outside the bubble of debris from the explosion.
The supernova explosion occurred ~ 10,000 years ago, and although the explosion debris originally expanded faster than the pulsar’s motion, the debris was slowed by its encounter with the tenuous material in interstellar space. This allowed the pulsar to catch up and overtake the debris, ~ 5,000 years after the explosion. The pulsar’s speed of nearly 700 miles per second means that it will eventually escape our Milky Way Galaxy.
The VLA image covers a region of ~ 1 square degree on the sky, observed in a single telescope pointing. For such wide fields, sky curvature and non-coplanar baselines introduce image artifacts around sources away from the phase center in standard 2D imaging. Moreover, care has to be taken in handling the antenna aperture and anti-aliasing functions in the convolution algorithm used for gridding. To image such a wide field-of-view and deal with these so-called A- and W-projection effects, the team relied on the AW-Projection algorithm in the CASA task tclean, which is currently being commissioned for general use.
The AW-Projection algorithm was developed by the Algorithm and Research Development Group at NRAO, which works closely with the CASA team on implementing new data processing algorithms for radio astronomy. This algorithm is currently undergoing commissioning for the VLA Sky Survey pipeline and is being tested for a variety of other use cases. We aim to officially endorse the AW-Projection algorithm for general use as part of the CASA 5.6 release. The calibration of the VLA data was done using the VLA calibration pipeline. Imaging for this project also utilized parallel processing using up to 80 CPU cores to gain close to linear speed-up in run time, reducing the imaging time from days to hours.
This work was presented at the High Energy Astrophysics Division meeting of the American Astronomical Society in Monterey, California and has been accepted for publication to The Astrophysical Journal Letters: F.K. Schinzel (NRAO), M. Kerr (NRL), U. Rau, S. Bhatnagar, D. A. Frail (NRAO), The Tail of PSR J0002+6216 and the Supernova Remnant CTB 1.