
Service Observing
NRAO Service Observation of radio burst in SGR 1935+2154 (ATel #13675, #13681 & #13684)
On April 27, 2020, the Swift Burst Alert Telescope observed a forest of bursts from magnetar SGR 1935+2154. The next day the CHIME/FRB backend and STARE2 independently detected a bright radio burst from this object. NRAO performed service observations of this source under project code TOBS0012 on 2020 April 29 and 30 in the VLA's C-configuration. The raw visibility data and pipeline calibration files can be downloaded from the NRAO archive.
NRAO Service Observation of SN2020oi in M100 (ATel #13398 & #13400)
On January 9, 2020, a type Ic supernova (SN2020oi) was discovered by the Zwicky Transient Facility at RA, DEC (J2000) = 12:22:54.910,+15:49:24.97 in M100. NRAO performed service observations of this source under project code TOBS0011 on 2020 January 10, 11, 12, and 13 in the VLA's D-configuration. The raw visibility data and pipeline calibration files can be downloaded from the NRAO archive.
NRAO Service Observation of the ANTARES neutrino source, 1625-2723 (ATel #7987)
On September 1, 2015, at 07:38:25 UT, ANTARES detected a bright neutrino source at RA(J2000) = 16h 25m 42s, dec (J2000) = -27d 23m 24s, with an uncertainty of 18 arcmin (radius, 50% containment). In response to this event NRAO observed the field at L-band (1-2 GHz) using the VLA in its most extended A-configuration, on September 3, 2015, 22:19 to 23:19 UT, under project code TOBS0009. The raw visibility data can be downloaded from the NRAO archive.
The calibrated and flagged visibility data are available as a tarred, gzipped, CASA measurement set, and may be downloaded here: ANT1625-2723.ms.tar.gz
A preliminary image, with no self-calibration but corrected for the response of the primary beam, in FITS format, is located here: ANT1625-2723_Lband.fits
A second epoch, to enable searches for time variable radio sources, was observed on September 4, 2015, 22:15 to 23:15 UT. The calibrated, flagged, visibility data are available here: ANT1625-2723.ms.tar.gz.
NRAO Initial Observation of the Type 1a Supernova in M82
A new type 1a supernova in the nearby starburst galaxy M82 was discovered on Jan 22, 2014, by students at University College, London. Initial radio observations have been performed using the VLA on Jan 23 and Jan 24, 2014, as a community service, under project code TOBS0008. The observations comprised one 2-hr scheduling block observing at 5.5 and 22 GHz, and an additional 2-hr scheduling block observing only at 5.5 GHz (Jan 23); a 4-hr scheduling block at 5.5 GHz was observed on Jan 24. The raw archive data are available for download from the NRAO archive. The calibrated visibility data are available via anonymous ftp as tarred CASA measurement sets:
ftp ftp.aoc.nrao.edu
cd e2earchive/TOBS0008
To obtain the calibrated 22 GHz data (includes spectral averaging to reduce dataset size):
get SN2014J_K.tar
To obtain the calibrated 5.5 GHz data:
get SN2014J_C1.tar
get SN2014J_C2.tar
get SN2014J_C3.tar
A FITS format image derived from the combined 5.5 GHz data is also available at the same location (NB: this image has NOT been corrected for the response of the primary beam; it should NOT be used to derive flux densities at any location other than at the center of the image):
get SN2014J_Cband.fits
NRAO Monitoring of the Galactic Center/G2 Cloud Encounter
NRAO has now completed its monitoring observations of the Galactic Center region through the encounter with the G2 cloud (see the October 2012 NRAO eNews). The VLA monitoring data have been obtained under project code TOBS0006, and the raw data are available through the NRAO Archive. Photometry, calibrated visibility data, and some images are posted below.
2014 May 31, VLA A-configuration
The emission detected in A configuration from the Galactic Center region in early 2014 looks marginally curved and may be interpreted as a slight flattening at the lower frequency end (see the A-configuration flux density baseline images from October 14, 2012).
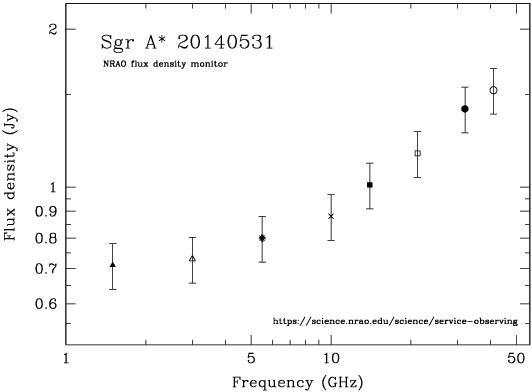
| Frequency (GHz) | Integrated flux density (Jy) | Statistical error (mJy) | Absolute calibration uncertainty | Calibrated uv-data (CASA MS format) |
|---|---|---|---|---|
| 1.5 | 0.71 | 1.9 | 10% | link (right-click to download) |
| 3.0 | 0.73 | 0.8 | 10% | link (right-click to download) |
| 5.5 | 0.80 | 0.5 | 10% | link (right-click to download) |
| 10.0 | 0.88 | 0.6 | 10% | link (right-click to download) |
| 14.0 | 1.01 | 0.7 | 10% | link (right-click to download) |
| 21.2 | 1.16 | 0.3 | 10% | link (right-click to download) |
| 32.0 | 1.41 | 0.2 | 10% | link (right-click to download) |
| 41.0 | 1.53 | 0.2 | 10% | link (right-click to download) |
2014 April 26, VLA A-configuration
The emission detected in A configuration from the Galactic Center region in early 2014 looks marginally curved and may be interpreted as a slight flattening at the lower frequency end (see the A-configuration flux density baseline images from October 14, 2012). However, with only an upper limit available in S band, at this stage this is still not significant.

| Frequency (GHz) | Integrated flux density (Jy) | Statistical error (mJy) | Absolute calibration uncertainty | Calibrated uv-data (CASA MS format) |
|---|---|---|---|---|
| 1.5 | 0.61 | 2.3 | 10% | Please contact the NRAO helpdesk for calibrated data |
| 3.0 | 0.75 (upper limit) | 10% | Please contact the NRAO helpdesk for calibrated data | |
| 5.5 | 0.76 | 0.6 | 10% | Please contact the NRAO helpdesk for calibrated data |
| 10.0 | 0.85 | 0.4 | 10% | Please contact the NRAO helpdesk for calibrated data |
| 14.0 | 0.94 | 0.6 | 10% | Please contact the NRAO helpdesk for calibrated data |
| 21.2 | 1.05 | 0.3 | 10% | Please contact the NRAO helpdesk for calibrated data |
| 32.0 | 1.26 | 0.2 | 10% | Please contact the NRAO helpdesk for calibrated data |
| 41.0 | 1.46 | 0.2 | 10% | Please contact the NRAO helpdesk for calibrated data |
2014 March 22, VLA A-configuration
The emission detected in A configuration from the Galactic Center region in early 2014 looks marginally curved and may be interpreted as a slight flattening at the lower frequency end (see the A-configuration flux density baseline images from October 14, 2012). However, at this stage this is still not significant because of an inconclusive measurement at 1.5 GHz, where only an upper limit is available for the flux density of SgrA*.
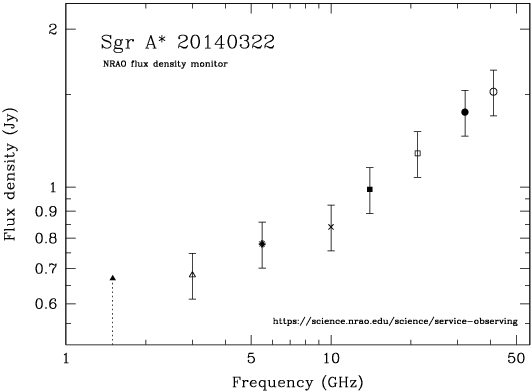
| Frequency (GHz) | Integrated flux density (Jy) | Statistical error (mJy) | Absolute calibration uncertainty | Calibrated uv-data (CASA MS format) |
|---|---|---|---|---|
| 1.5 | 0.68 (upper limit) | 10% | Please contact the NRAO helpdesk for calibrated data | |
| 3.0 | 0.68 | 1.4 | 10% | Please contact the NRAO helpdesk for calibrated data |
| 5.5 | 0.78 | 1.4 | 10% | Please contact the NRAO helpdesk for calibrated data |
| 10.0 | 0.84 | 0.8 | 10% | Please contact the NRAO helpdesk for calibrated data |
| 14.0 | 0.99 | 0.6 | 10% | Please contact the NRAO helpdesk for calibrated data |
| 21.2 | 1.16 | 0.4 | 10% | Please contact the NRAO helpdesk for calibrated data |
| 32.0 | 1.39 | 0.3 | 10% | Please contact the NRAO helpdesk for calibrated data |
| 41.0 | 1.53 | 0.3 | 10% | Please contact the NRAO helpdesk for calibrated data |
2014 February 15, VLA A-configuration
The emission detected in A configuration from the Galactic Center region in early 2014 looks marginally curved and may be interpreted as a slight flattening at the lower frequency end (see the A-configuration flux density baseline images from October 14, 2012). However, at this stage this is still not significant because of an inconclusive measurement at 1.5 GHz, where only an upper limit is available for the flux density of SgrA*.
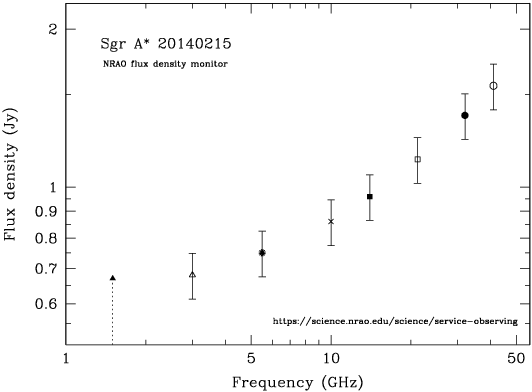
| Frequency (GHz) | Integrated flux density (Jy) | Statistical error (mJy) | Absolute calibration uncertainty | Calibrated uv-data (CASA MS format) |
|---|---|---|---|---|
| 1.5 | 0.67 (upper limit) | 10% | Please contact the NRAO helpdesk for calibrated data | |
| 3.0 | 0.68 | 1.4 | 10% | Please contact the NRAO helpdesk for calibrated data |
| 5.5 | 0.75 | 1.0 | 10% | Please contact the NRAO helpdesk for calibrated data |
| 10.0 | 0.86 | 1.0 | 10% | Please contact the NRAO helpdesk for calibrated data |
| 14.0 | 0.96 | 0.5 | 10% | Please contact the NRAO helpdesk for calibrated data |
| 21.2 | 1.13 | 0.6 | 10% | Please contact the NRAO helpdesk for calibrated data |
| 32.0 | 1.37 | 0.4 | 10% | Please contact the NRAO helpdesk for calibrated data |
| 41.0 | 1.56 | 0.7 | 10% | Please contact the NRAO helpdesk for calibrated data |
2013 December 29, VLA B-configuration
Only the lowest frequency emission detected in B configuration from the Galactic Center region is still somewhat confused (see the A-configuration flux density baseline images from October 14, 2012). Only upper limits are available for the flux density of SgrA* at the lowest frequencies. Flux densities have been derived using Briggs (robust=0) weighting.
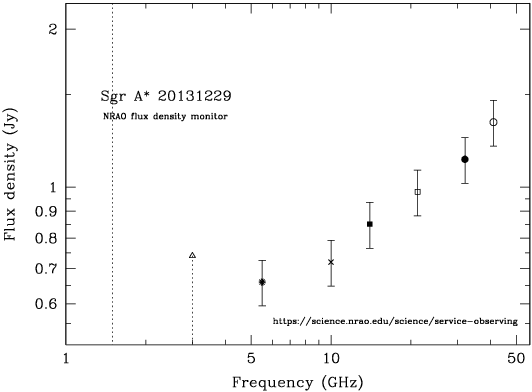
| Frequency (GHz) | Integrated flux density (Jy) | Statistical error (mJy) | Absolute calibration uncertainty | Calibrated uv-data (CASA MS format) |
|---|---|---|---|---|
| 1.5 | 3.9 (upper limit) | 10% | Please contact the NRAO helpdesk for calibrated data | |
| 3.0 | 0.7 (upper limit) | 10% | Please contact the NRAO helpdesk for calibrated data | |
| 5.5 | 0.66 | 3.5 | 10% | Please contact the NRAO helpdesk for calibrated data |
| 10.0 | 0.72 | 3.9 | 10% | Please contact the NRAO helpdesk for calibrated data |
| 14.0 | 0.85 | 3.1 | 10% | Please contact the NRAO helpdesk for calibrated data |
| 21.2 | 0.98 | 2.0 | 10% | Please contact the NRAO helpdesk for calibrated data |
| 32.0 | 1.13 | 1.5 | 10% | Please contact the NRAO helpdesk for calibrated data |
| 41.0 | 1.33 | 1.3 | 10% | Please contact the NRAO helpdesk for calibrated data |
2013 November 29, VLA B-configuration
Only the lowest frequency emission detected in B configuration from the Galactic Center region is still somewhat confused (see the A-configuration flux density baseline images from October 14, 2012). Only upper limits are available for the flux density of SgrA* at the lowest frequencies. Flux densities have been derived using Briggs (robust=0) weighting.
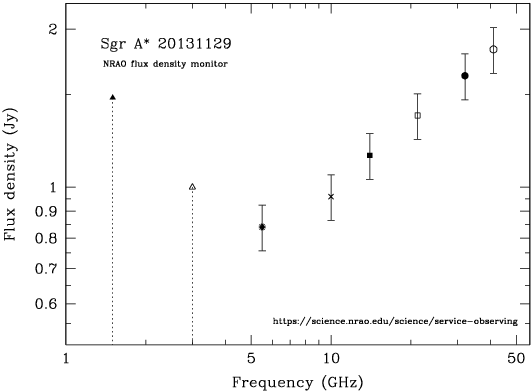
| Frequency (GHz) | Integrated flux density (Jy) | Statistical error (mJy) | Absolute calibration uncertainty | Calibrated uv-data (CASA MS format) |
|---|---|---|---|---|
| 1.5 | 1.5 (upper limit) | 10% | Please contact the NRAO helpdesk for calibrated data | |
| 3.0 | 1.0 (upper limit) | 10% | Please contact the NRAO helpdesk for calibrated data | |
| 5.5 | 0.84 | 0.9 | 10% | Please contact the NRAO helpdesk for calibrated data |
| 10.0 | 0.96 | 0.6 | 10% | Please contact the NRAO helpdesk for calibrated data |
| 14.0 | 1.15 | 1.1 | 10% | Please contact the NRAO helpdesk for calibrated data |
| 21.2 | 1.37 | 0.7 | 10% | Please contact the NRAO helpdesk for calibrated data |
| 32.0 | 1.63 | 0.9 | 10% | Please contact the NRAO helpdesk for calibrated data |
| 41.0 | 1.83 | 0.5 | 10% | Please contact the NRAO helpdesk for calibrated data |
2013 October 26, VLA B-configuration
Only the lowest frequency emission detected in B configuration from the Galactic Center region is still somewhat confused (see the A-configuration flux density baseline images from October 14, 2012). Only upper limits are available for the flux density of SgrA* at the lowest frequencies. Flux densities have been derived using Briggs (robust=0) weighting.
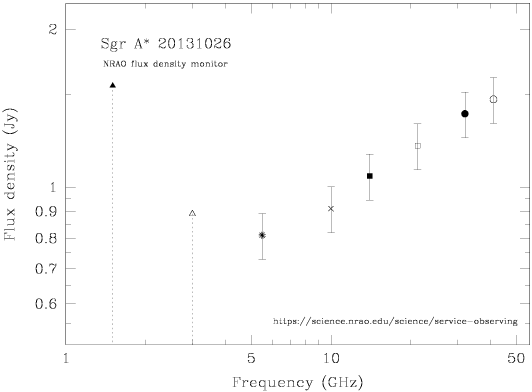
| Frequency (GHz) | Integrated flux density (Jy) | Statistical error (mJy) | Absolute calibration uncertainty | Calibrated uv-data (CASA MS format) |
|---|---|---|---|---|
| 1.5 | 1.6 (upper limit) | 10% | Please contact the NRAO helpdesk for calibrated data | |
| 3.0 | 0.89 (upper limit) | 10% | Please contact the NRAO helpdesk for calibrated data | |
| 5.5 | 0.81 | 1.5 | 10% | Please contact the NRAO helpdesk for calibrated data |
| 10.0 | 0.91 | 1.3 | 10% | Please contact the NRAO helpdesk for calibrated data |
| 14.0 | 1.05 | 1.2 | 10% | Please contact the NRAO helpdesk for calibrated data |
| 21.2 | 1.20 | 0.8 | 10% | Please contact the NRAO helpdesk for calibrated data |
| 32.0 | 1.38 | 0.6 | 10% | Please contact the NRAO helpdesk for calibrated data |
| 41.0 | 1.47 | 0.5 | 10% | Please contact the NRAO helpdesk for calibrated data |
2013 September 18, VLA CnB-configuration
The emission from the Galactic Center region is still somewhat confused in the CnB-configuration, especially at low frequencies (see the A-configuration images from October 14, 2012). Flux densities have been derived from images using inner uv-cutoffs, and Briggs (robust=0) weighting. Only upper limits are available for the flux density of SgrA* at the lower frequencies. The weather was poor during this epoch, with light rain during the observation. The uncertainty on the absolute flux density at the high frequencies is therefore larger than at other epochs.
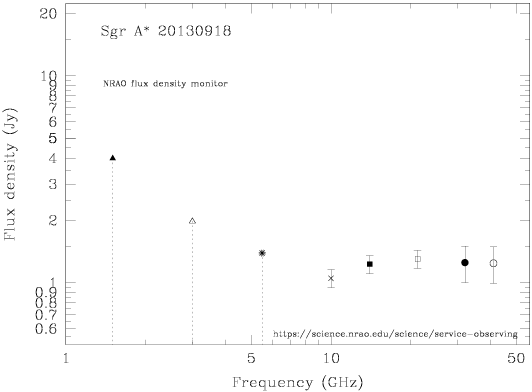
| Frequency (GHz) | Integrated flux density (Jy) | Statistical error (mJy) | Absolute calibration uncertainty | Calibrated uv-data (CASA MS format) |
|---|---|---|---|---|
| 1.5 | 4.0 (upper limit) | 10% | Please contact the NRAO helpdesk for calibrated data | |
| 3.0 | 1.99 (upper limit) | 10% | Please contact the NRAO helpdesk for calibrated data | |
| 5.5 | 1.39 (upper limit) | 10% | Please contact the NRAO helpdesk for calibrated data | |
| 10.0 | 1.039 | 1.8 | 10% | Please contact the NRAO helpdesk for calibrated data |
| 14.0 | 1.234 | 1.3 | 10% | Please contact the NRAO helpdesk for calibrated data |
| 21.2 | 1.303 | 0.7 | 10% | Please contact the NRAO helpdesk for calibrated data |
| 32.0 | 1.252 | 0.8 | 20% | Please contact the NRAO helpdesk for calibrated data |
| 41.0 | 1.244 | 0.7 | 20% | Please contact the NRAO helpdesk for calibrated data |
2013 August 08, VLA C-configuration
The emission from the Galactic Center region is still somewhat confused in the C-configuration, especially at low frequencies (see the A-configuration images from October 14, 2012). Flux densities have been derived from images using inner uv-cutoffs, and Briggs (robust=0) weighting. Only upper limits are available for the flux density of SgrA* at the lower frequencies.
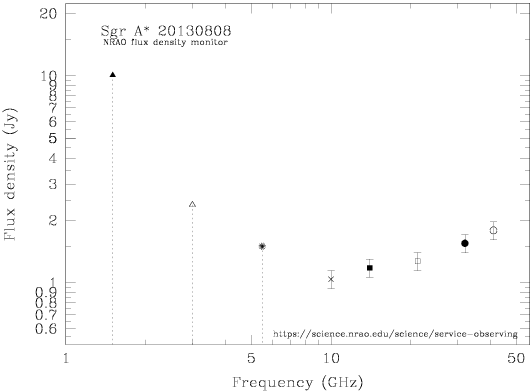
| Frequency (GHz) | Integrated flux density (Jy) | Statistical error (mJy) | Absolute calibration uncertainty | Calibrated uv-data (CASA MS format) |
|---|---|---|---|---|
| 1.5 | 10.1 (upper limit) | 10% | Please contact the NRAO helpdesk for calibrated data | |
| 3.0 | 2.38 (upper limit) | 10% | Please contact the NRAO helpdesk for calibrated data | |
| 5.5 | 1.50 (upper limit) | 10% | Please contact the NRAO helpdesk for calibrated data | |
| 10.0 | 1.044 | 7.1 | 10% | Please contact the NRAO helpdesk for calibrated data |
| 14.0 | 1.180 | 4.8 | 10% | Please contact the NRAO helpdesk for calibrated data |
| 21.2 | 1.270 | 2.2 | 10% | Please contact the NRAO helpdesk for calibrated data |
| 32.0 | 1.547 | 2.6 | 10% | Please contact the NRAO helpdesk for calibrated data |
| 41.0 | 1.791 | 2.6 | 10% | Please contact the NRAO helpdesk for calibrated data |
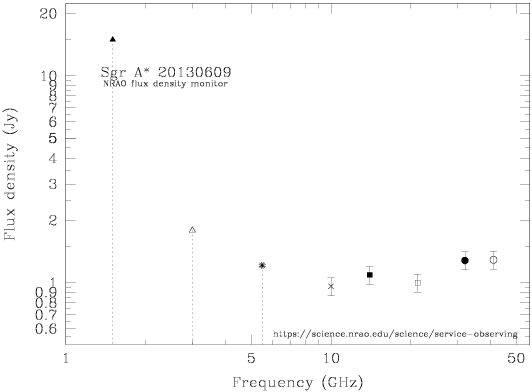
2013 June 09, VLA C-configuration
The emission from the Galactic Center region is still somewhat confused in the C-configuration, especially at low frequencies (see the A-configuration images from October 14, 2012). Flux densities have been derived from images using inner uv-cutoffs, and Briggs (robust=0) weighting. Only upper limits are available for the flux density of SgrA* at the lower frequencies.
| Frequency (GHz) | Integrated flux density (Jy) | Statistical error (mJy) | Absolute calibration uncertainty | Calibrated uv-data (CASA MS format) |
|---|---|---|---|---|
| 1.5 | 15.0 (upper limit) | 10% | Please contact the NRAO helpdesk for calibrated data | |
| 3.0 | 1.79 (upper limit) | 10% | Please contact the NRAO helpdesk for calibrated data | |
| 5.5 | 1.21 (upper limit) | 10% | Please contact the NRAO helpdesk for calibrated data | |
| 10.0 | 0.964 | 2.1 | 10% | Please contact the NRAO helpdesk for calibrated data |
| 14.0 | 1.086 | 2.5 | 10% | Please contact the NRAO helpdesk for calibrated data |
| 21.2 | 0.999 | 1.9 | 10% | Please contact the NRAO helpdesk for calibrated data |
| 32.0 | 1.282 | 1.9 | 10% | Please contact the NRAO helpdesk for calibrated data |
| 41.0 | 1.293 | 1.7 | 10% | Please contact the NRAO helpdesk for calibrated data |
2013 April 26, VLA D-configuration
The emission from the Galactic Center region is very confused in the D-configuration, especially at low frequencies (see the A-configuration images from October 14, 2012). Flux densities have been derived from images using inner uv-cutoffs, and Briggs (robust=0) weighting. Only upper limits are available for the flux density of SgrA* at the lower frequencies.

| Frequency (GHz) | Integrated flux density (Jy) | Statistical error (mJy) | Absolute calibration uncertainty | Calibrated uv-data (CASA MS format) |
|---|---|---|---|---|
| 1.5 | 17.3 (upper limit) | 10% | Please contact the NRAO helpdesk for calibrated data | |
| 3.0 | 7.80 (upper limit) | 10% | Please contact the NRAO helpdesk for calibrated data | |
| 5.5 | 2.37 (upper limit) | 10% | Please contact the NRAO helpdesk for calibrated data | |
| 10.0 | 2.65 (upper limit) | 10% | Please contact the NRAO helpdesk for calibrated data | |
| 14.0 | 1.59 (upper limit) | 10% | Please contact the NRAO helpdesk for calibrated data | |
| 21.2 | 1.195 | 1.7 | 10% | Please contact the NRAO helpdesk for calibrated data |
| 32.0 | 1.545 | 2.3 | 10% | Please contact the NRAO helpdesk for calibrated data |
| 41.0 | 1.791 | 1.4 | 10% | Please contact the NRAO helpdesk for calibrated data |
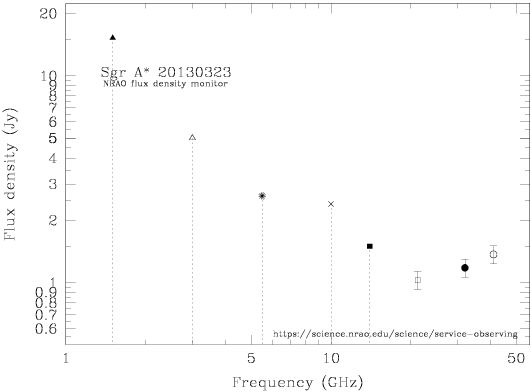
2013 March 23, VLA D-configuration
The emission from the Galactic Center region is very confused in the D-configuration, especially at low frequencies (see the A-configuration images from October 14, 2012). Flux densities have been derived from images using inner uv-cutoffs, and Briggs (robust=0) weighting. Only upper limits are available for the flux density of SgrA* at the lower frequencies.
| Frequency (GHz) | Integrated flux density (Jy) | Statistical error (mJy) | Absolute calibration uncertainty | Calibrated uv-data (CASA MS format) |
|---|---|---|---|---|
| 1.5 | 15.2 (upper limit) | 10% | Please contact the NRAO helpdesk for calibrated data | |
| 3.0 | 5.00 (upper limit) | 10% | Please contact the NRAO helpdesk for calibrated data | |
| 5.5 | 2.63 (upper limit) | 10% | Please contact the NRAO helpdesk for calibrated data | |
| 10.0 | 2.40 (upper limit) | 10% | Please contact the NRAO helpdesk for calibrated data | |
| 14.0 | 1.50 (upper limit) | 10% | Please contact the NRAO helpdesk for calibrated data | |
| 21.2 | 1.029 | 2.0 | 10% | Please contact the NRAO helpdesk for calibrated data |
| 32.0 | 1.179 | 2.0 | 10% | Please contact the NRAO helpdesk for calibrated data |
| 41.0 | 1.367 | 1.3 | 10% | Please contact the NRAO helpdesk for calibrated data |
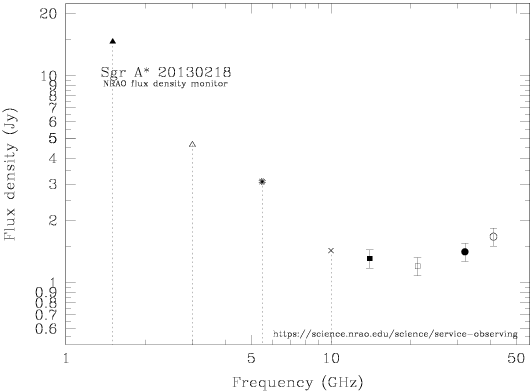
2013 February 18, VLA D-configuration
The emission from the Galactic Center region is very confused in the D-configuration, especially at low frequencies (see the A-configuration images from October 14, 2012). Flux densities have been derived from images using inner uv-cutoffs, and Briggs (robust=0) weighting. Only upper limits are available for the flux density of SgrA* at the lower frequencies.
| Frequency (GHz) | Integrated flux density (Jy) | Statistical error (mJy) | Absolute calibration uncertainty | Calibrated uv-data (CASA MS format) |
|---|---|---|---|---|
| 1.5 | 14.6 (upper limit) | 10% | Please contact the NRAO helpdesk for calibrated data | |
| 3.0 | 4.64 (upper limit) | 10% | Please contact the NRAO helpdesk for calibrated data | |
| 5.5 | 3.08 (upper limit) | 10% | Please contact the NRAO helpdesk for calibrated data | |
| 10.0 | 1.43 (upper limit) | 10% | Please contact the NRAO helpdesk for calibrated data | |
| 14.0 | 1.308 | 2,3 | 10% | Please contact the NRAO helpdesk for calibrated data |
| 21.2 | 1.200 | 1.5 | 10% | Please contact the NRAO helpdesk for calibrated data |
| 32.0 | 1.405 | 2.8 | 10% | Please contact the NRAO helpdesk for calibrated data |
| 41.0 | 1.672 | 1.5 | 10% | Please contact the NRAO helpdesk for calibrated data |
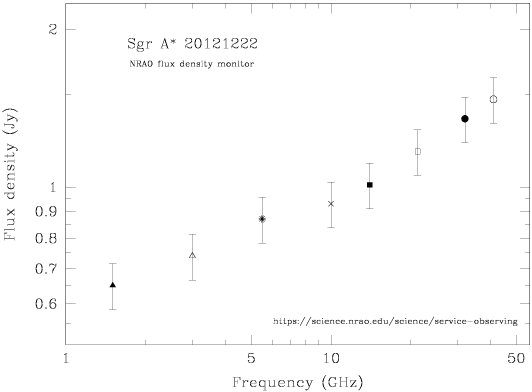
2012 December 22, VLA A-configuration
For images, please see the results from October 14, 2012.
| Frequency (GHz) | Integrated flux density (Jy) | Statistical error (mJy) | Absolute calibration uncertainty | Calibrated uv-data (CASA MS format) |
|---|---|---|---|---|
| 1.5 | 0.653 | 3.5 | 10% | Please contact the NRAO helpdesk for calibrated data |
| 3.0 | 0.737 | 0.78 | 10% | Please contact the NRAO helpdesk for calibrated data |
| 5.5 | 0.871 | 0.73 | 10% | Please contact the NRAO helpdesk for calibrated data |
| 10.0 | 0.932 | 0.80 | 10% | Please contact the NRAO helpdesk for calibrated data |
| 14.0 | 1.008 | 0.69 | 10% | Please contact the NRAO helpdesk for calibrated data |
| 21.2 | 1.173 | 0.48 | 10% | Please contact the NRAO helpdesk for calibrated data |
| 32.0 | 1.346 | 0.56 | 10% | Please contact the NRAO helpdesk for calibrated data |
| 41.0 | 1.475 | 0.44 | 10% | Please contact the NRAO helpdesk for calibrated data |
2012 October 14, VLA A-configuration
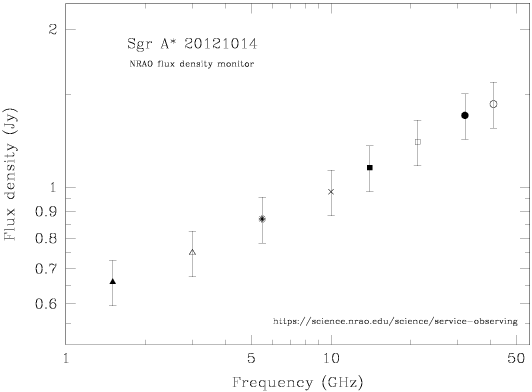
| Frequency (GHz) | Integrated flux density (Jy) | Statistical error (mJy) | Absolute calibration uncertainty | Image | FITS image |
Calibrated uv-data (CASA MS format) |
|---|---|---|---|---|---|---|
| 1.5 | 0.660 | 3.2 | 10% |
link (right-click to download) |
Please contact the NRAO helpdesk for calibrated data | |
| 3.0 | 0.750 | 0.58 | 10% |
link (right-click to download) |
Please contact the NRAO helpdesk for calibrated data | |
| 5.5 | 0.870 | 0.54 | 10% |
link (right-click to download) |
Please contact the NRAO helpdesk for calibrated data | |
| 10.0 | 0.983 | 0.36 | 10% |
link (right-click to download) |
Please contact the NRAO helpdesk for calibrated data | |
| 14.0 | 1.090 | 0.34 | 10% |
link (right-click to download) |
Please contact the NRAO helpdesk for calibrated data | |
| 21.2 | 1.216 | 0.44 | 10% |
link (right-click to download) |
Please contact the NRAO helpdesk for calibrated data | |
| 32.0 | 1.375 | 0.71 | 10% |
link (right-click to download) |
Please contact the NRAO helpdesk for calibrated data | |
| 41.0 | 1.435 | 0.49 | 10% |
link (right-click to download) |
Please contact the NRAO helpdesk for calibrated data |

