
CASA News
Issue Iss#
Day# Month# Year#

CASA News
Issue Iss# • Day# Month# Year#
CASA 6.5
The Common Astronomy Software Applications (CASA) Team is pleased to announce that CASA version 6.5.5 has been released. CASA 6.5.5 is available either as downloadable tar-file, or through pip-wheel installation, which gives users the flexibility to integrate CASA into their customized Python environment (Python v3.6 or v3.8). CASA 6.5 is expected to work on a variety of Operating Systems. A compatibility matrix is provided in CASA Docs.
The past year included various highlights in terms of CASA development from CASA 6.5.0 – 6.5.5. All updates are incremental, meaning they are available in subsequent CASA releases.
Highlights for CASA 6.5
- CASA 6.5.5: This CASA version includes several improvements in tasks fringefit and applycal for improved VLBI calibration, as well as improved stability and performance of the awproject gridder in tclean.
- CASA 6.5.3: New additions include Python wheels for casafeather, casabrowser and casalogger. GUIs were added, as well as updated VLA flux calibrator model images at C, X and Ka bands. For task tclean, corrections to the uvtaper weighting scheme were implemented, while the simulator can now handle component lists and primary beams with spectral structure.
- CASA 6.5.2: A new task deconvolve was implemented for image-domain deconvolution, while task uvcontsub saw a new implementation. New parameters were added to various tasks and tools for enhanced functionality, including fingefit, tclean, sdimaging, and the simulator tool.
- CASA 6.5.1: This CASA version included a long list of bug fixes, including a fix to a bug in tclean, which prevented proper use of the UV taper parameter with natural weighting in CASA 6.2 - 6.5.0.
- CASA 6.5.0: A new single-dish task imbaseline was added for image-based baseline subtraction, and plotms increased its support for additional axes of calibration tables.
This is just a small fraction of new functionality and bug fixes that were included in CASA 6.5. For more information, please check out the Release Information in CASA Docs.
We welcome feedback from users on this new version of CASA.
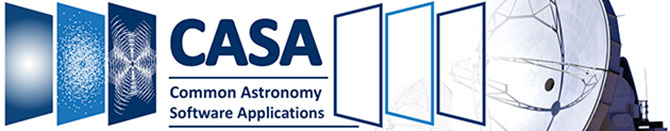
CASA Performance Tests
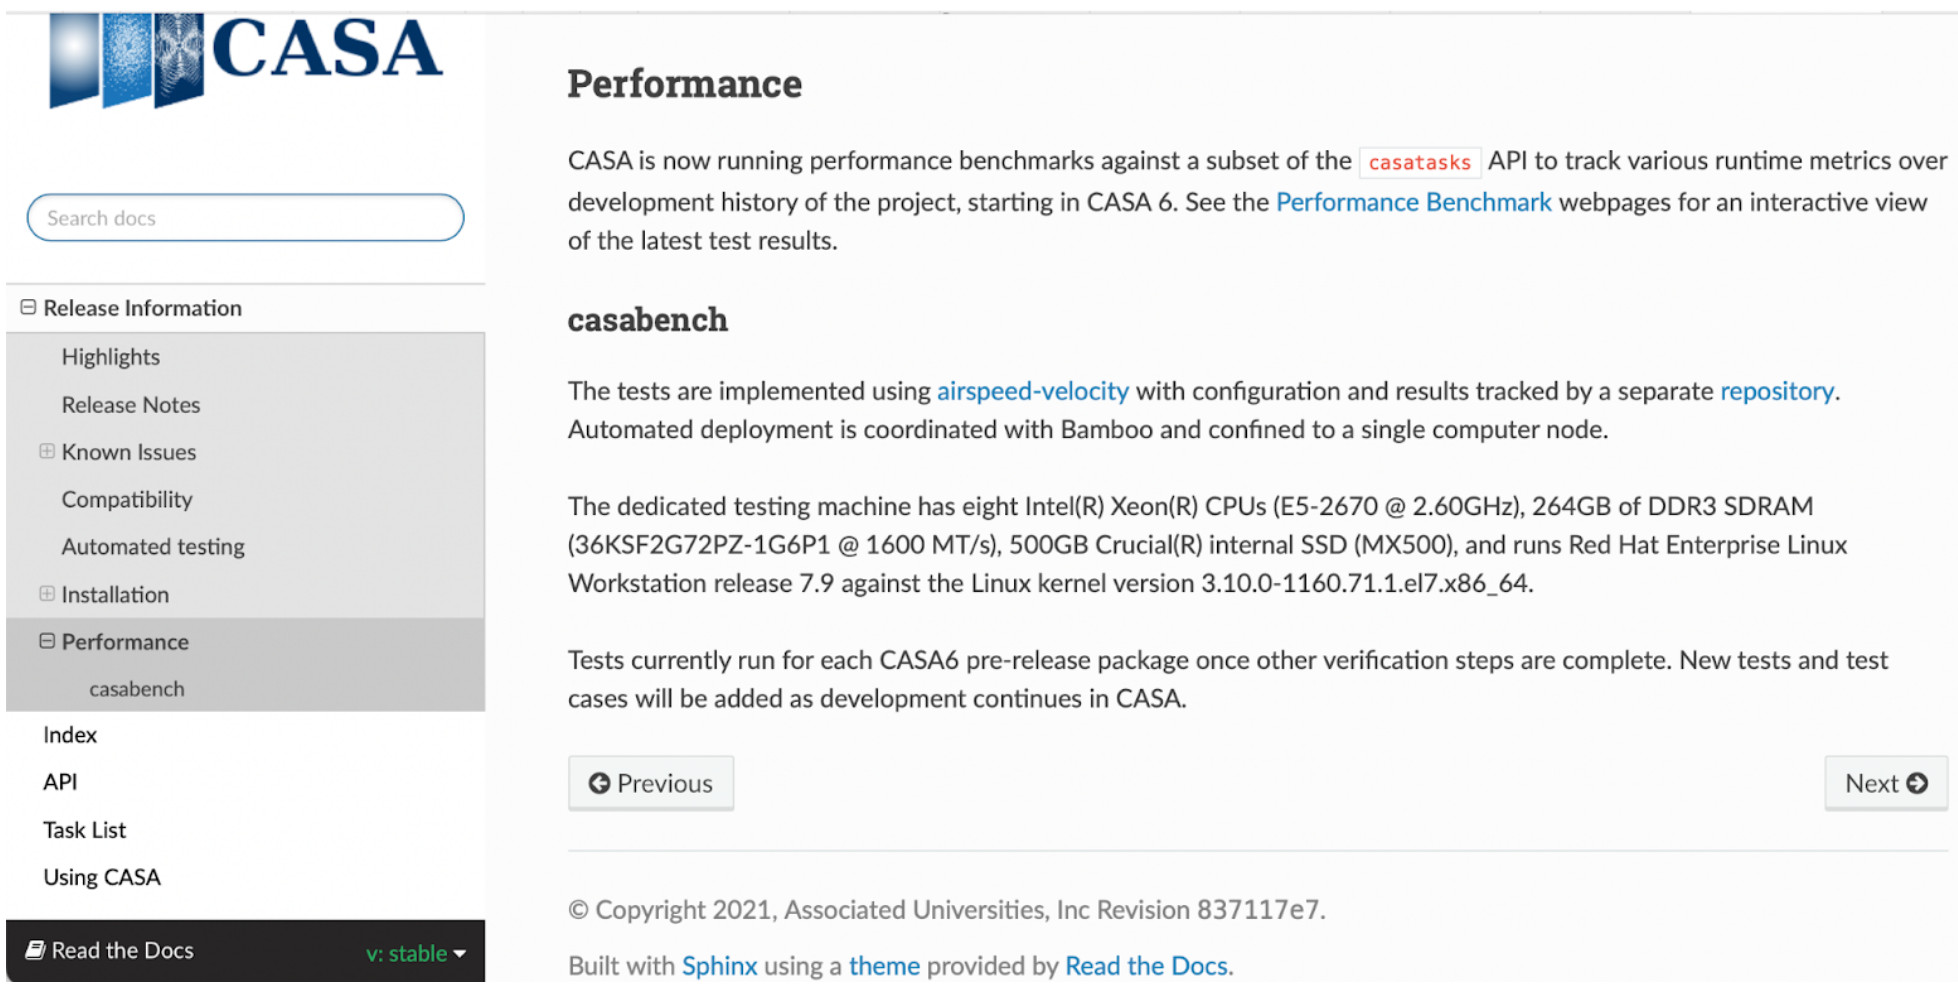
Figure 1. CASA Performance Tests included in CASA Docs since 6.5.2. From the right-hand side follow the links to Performance Benchmarking to see the latest performance curves of CASA’s main repository.
[click to enlarge]
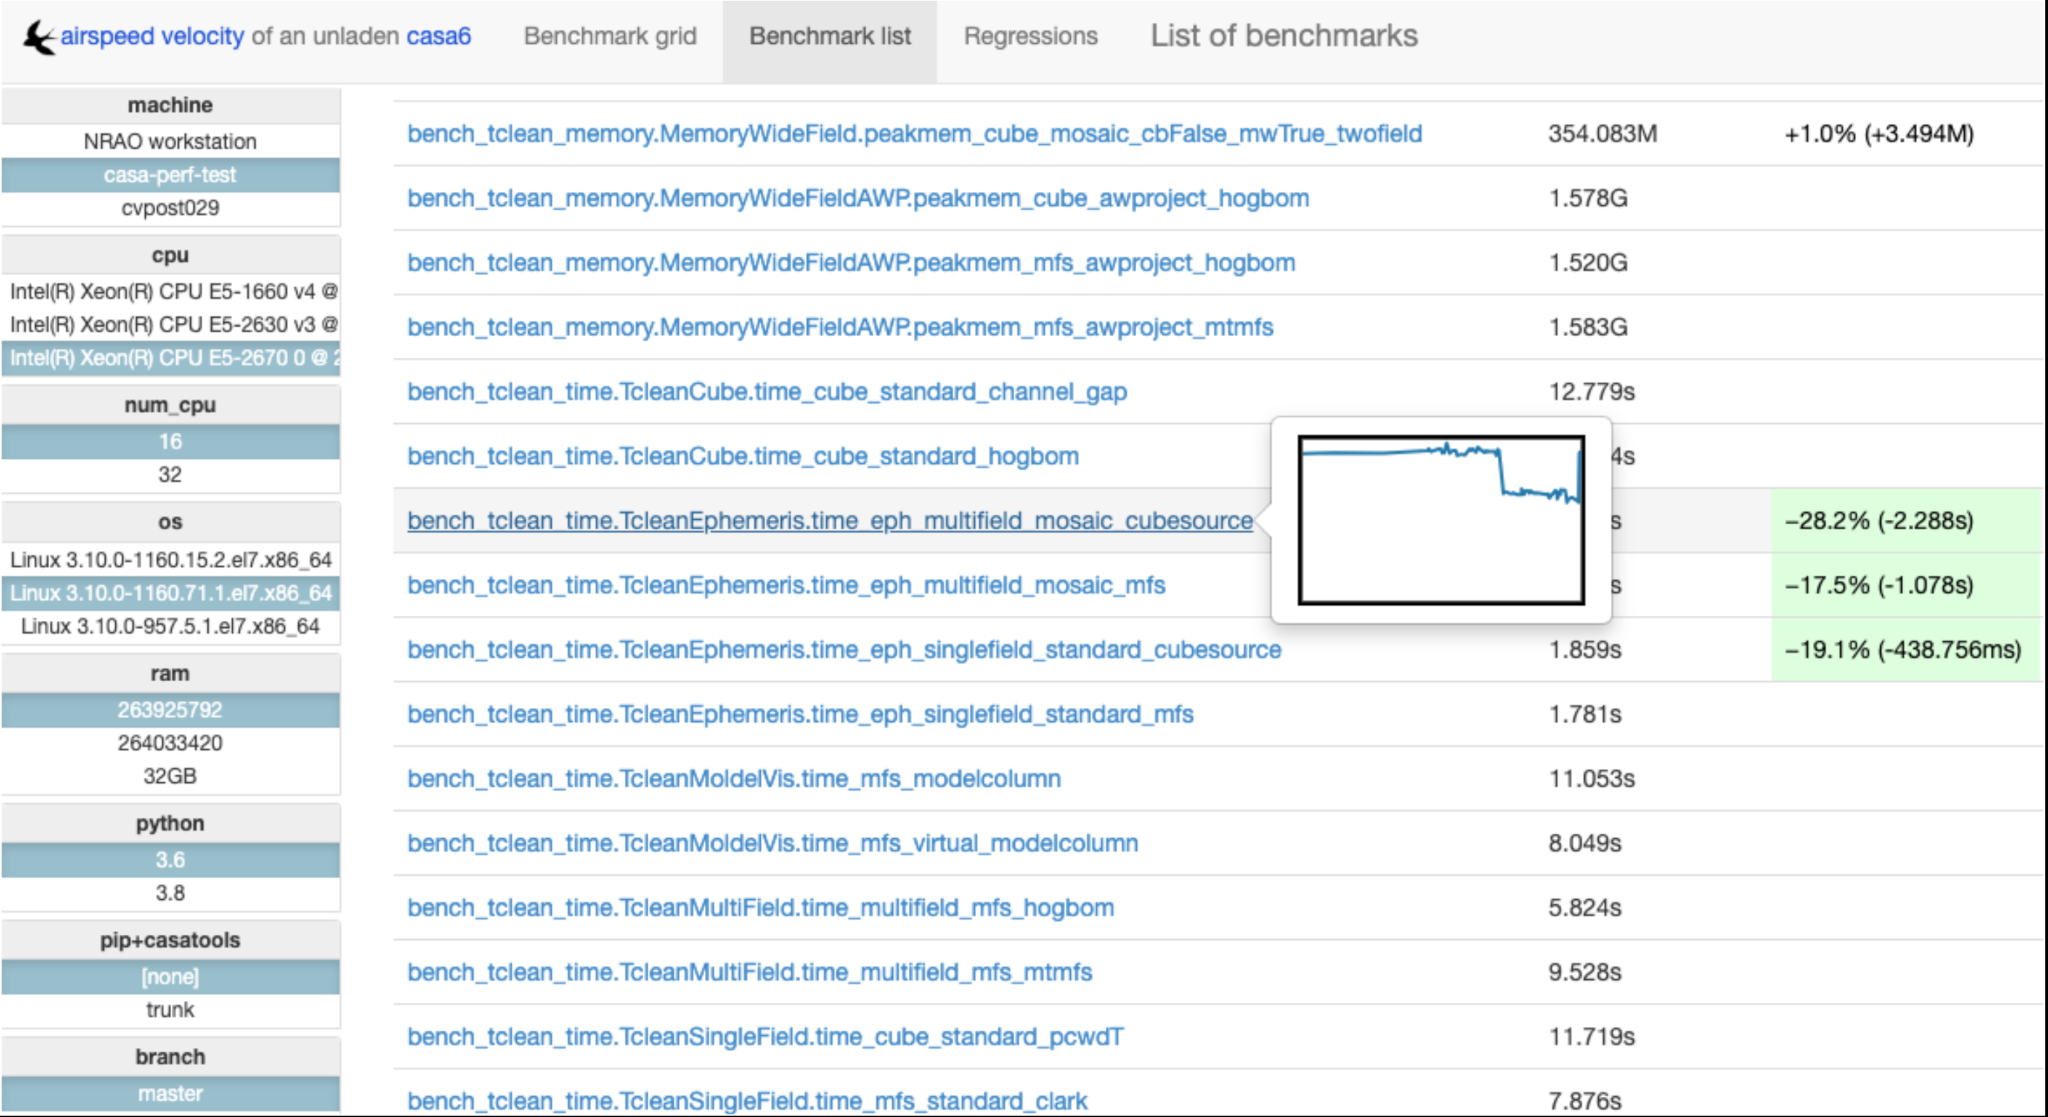
Figure 2. CASA Performance Test of task_tclean showing an improvement in runtime of about 30% for a test case using tclean in specmode cubesource of an ephemeris object. The highlighted benchmark name (with inset image) shows the runtime with timing results for each test in the column at the right and selected environment parameters in the column at the left.
[click to enlarge]
Figure 3. CASA Performance Test of task_sdbaseline usage mode showing the verification of an infrastructure feature. The highlighted benchmark name (with inset image) shows the runtime on the branch and on the right-hand side plot we see the combined runtime trend of main and feature branch for the individual test. The difference in test runtime was about 4 times higher in the branch, which flagged the development during the test phase and allowed developers to isolate and correct the issue before the feature was merged. The branch runtime is the star point and the runtime of main is represented by the polygons.
[click to enlarge]
The CASA verification tests provide functional testing of the CASA public API according to the documented definition of the code. The verification test suite is furthermore used to run automated and manual tests during the development cycle of features and bugfixes in CASA. Apart from providing functional tests, CASA’s verification suite also contains stakeholder and performance tests. The latter is shown in more detail in this article.
CASA Performance tests use the airspeed-velocity framework to track and analyze various performance metrics of a subset of CASA tasks. The first use-case for the inclusion of performance tests in CASA was implemented in 2022 to track the performance of CASA’s main repository, monitoring the health of the code before creating a release. The tests run automatically for tasks applycal, flagdata, gaincal, sdatmcor, sdbaseline, sdcal, sdimaging, tclean, tsdimaging and the new uvcontsub on every new CASA pre-release build. As part of the vast increase in test coverage that the CASA team implemented over the past years, we plan to maintain and extend this new suite of performance tests as a development resource going forward.
The CASA Performance tests have been included in the CASA documentation since version 6.5.2. The results of monitoring the performance of CASA’s main repository are linked from CASA Docs, as shown in Figure 1 for the latest stable release.
Figure 2 shows the performance tests framework with a highlighted benchmark test showing the benchmarking trend of the main repository. The highlighted inset image shows an improvement in runtime of task tclean for ephemeris objects using the cubesource specmode. The improvement in runtime for task tclean and tsdimaging were of the order of 30% and 60% respectively compared to the previous benchmark.
The second use-case of the CASA Performance tests is to measure the performance impact of code changes on feature branches during verification. As part of this testing phase of the development process, we run performance tests to compare the runtime and peak memory usage of tests run with the branch version of CASA against the main version of CASA as a reference. This allows testers to flag performance issues and request that developers check and fix problems when they arise – before they are merged to the main trunk of the repository.
See an example in Figure 3 of a slowdown detected in the sdbaseline task during the development of an infrastructure feature. The performance tests showed a slowdown of about 4 times compared to CASA’s main trunk, which was reported and fixed in a follow up ticket.
Imaging Dynamic Solar Phenomena
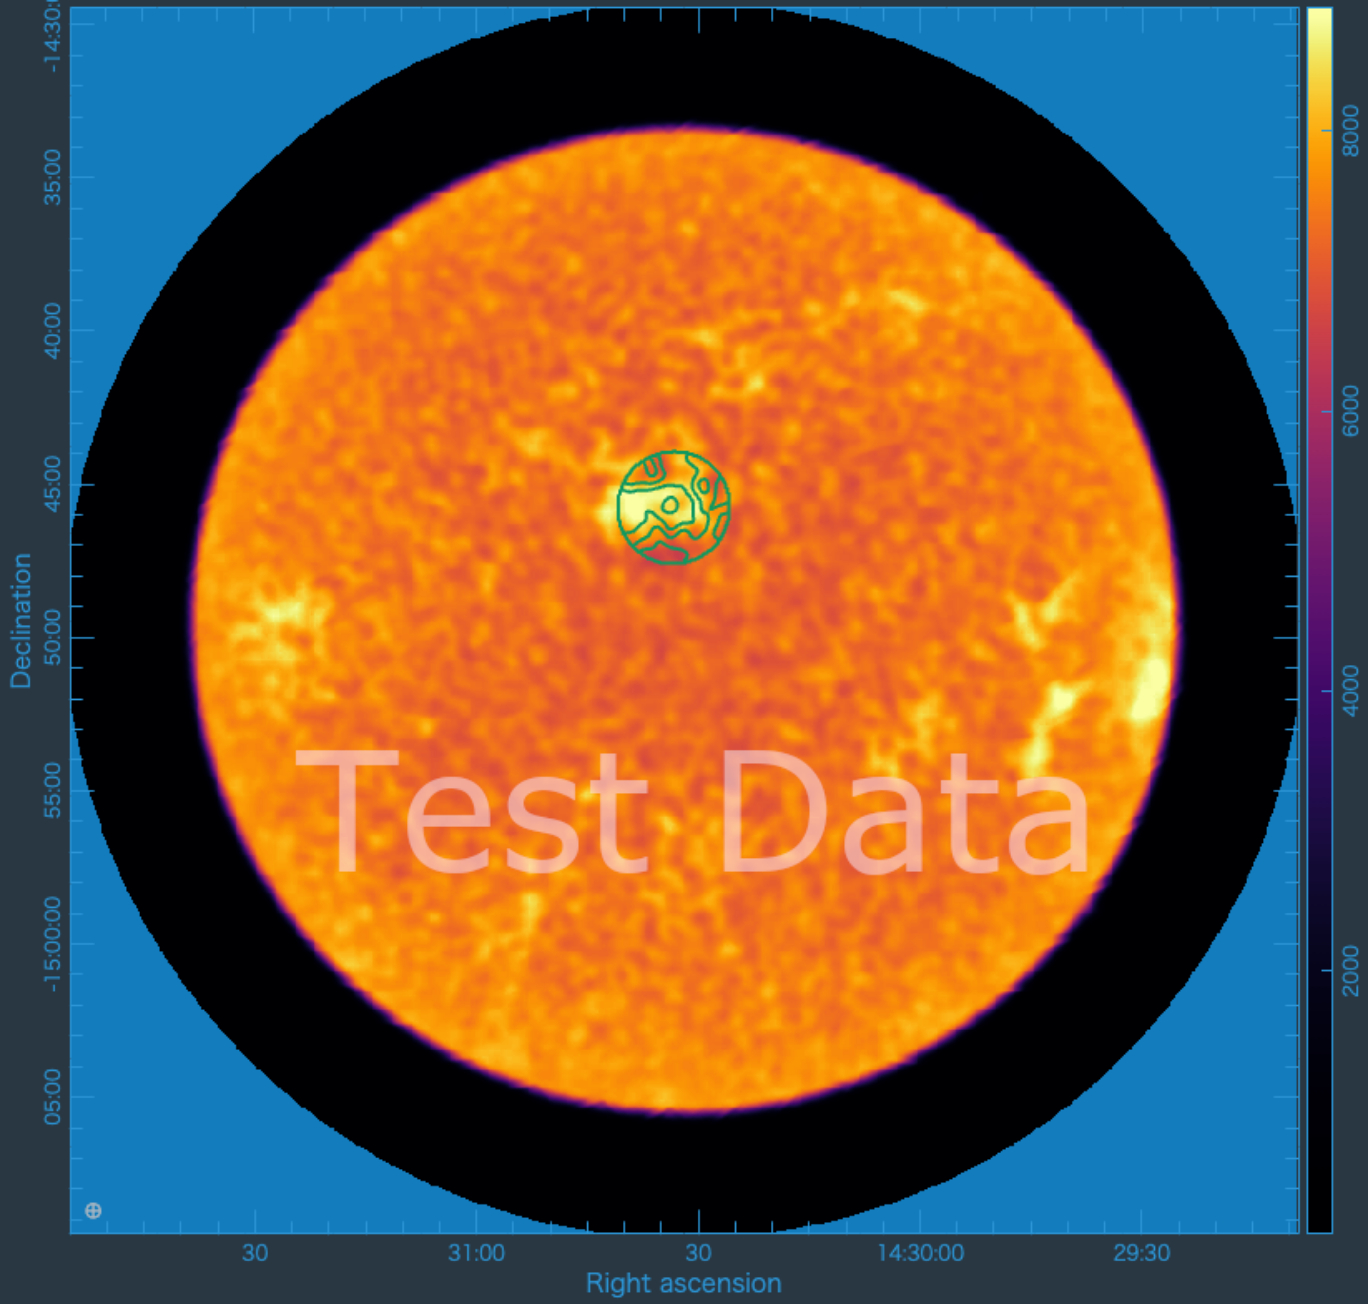
Figure 1: tsdimaging imaging result of the full Sun observed at ALMA Band 6, where the contours of the regional map image have been overlaid using CARTA. Credit: Masumi Shimojo, NAOJ
[click to enlarge]
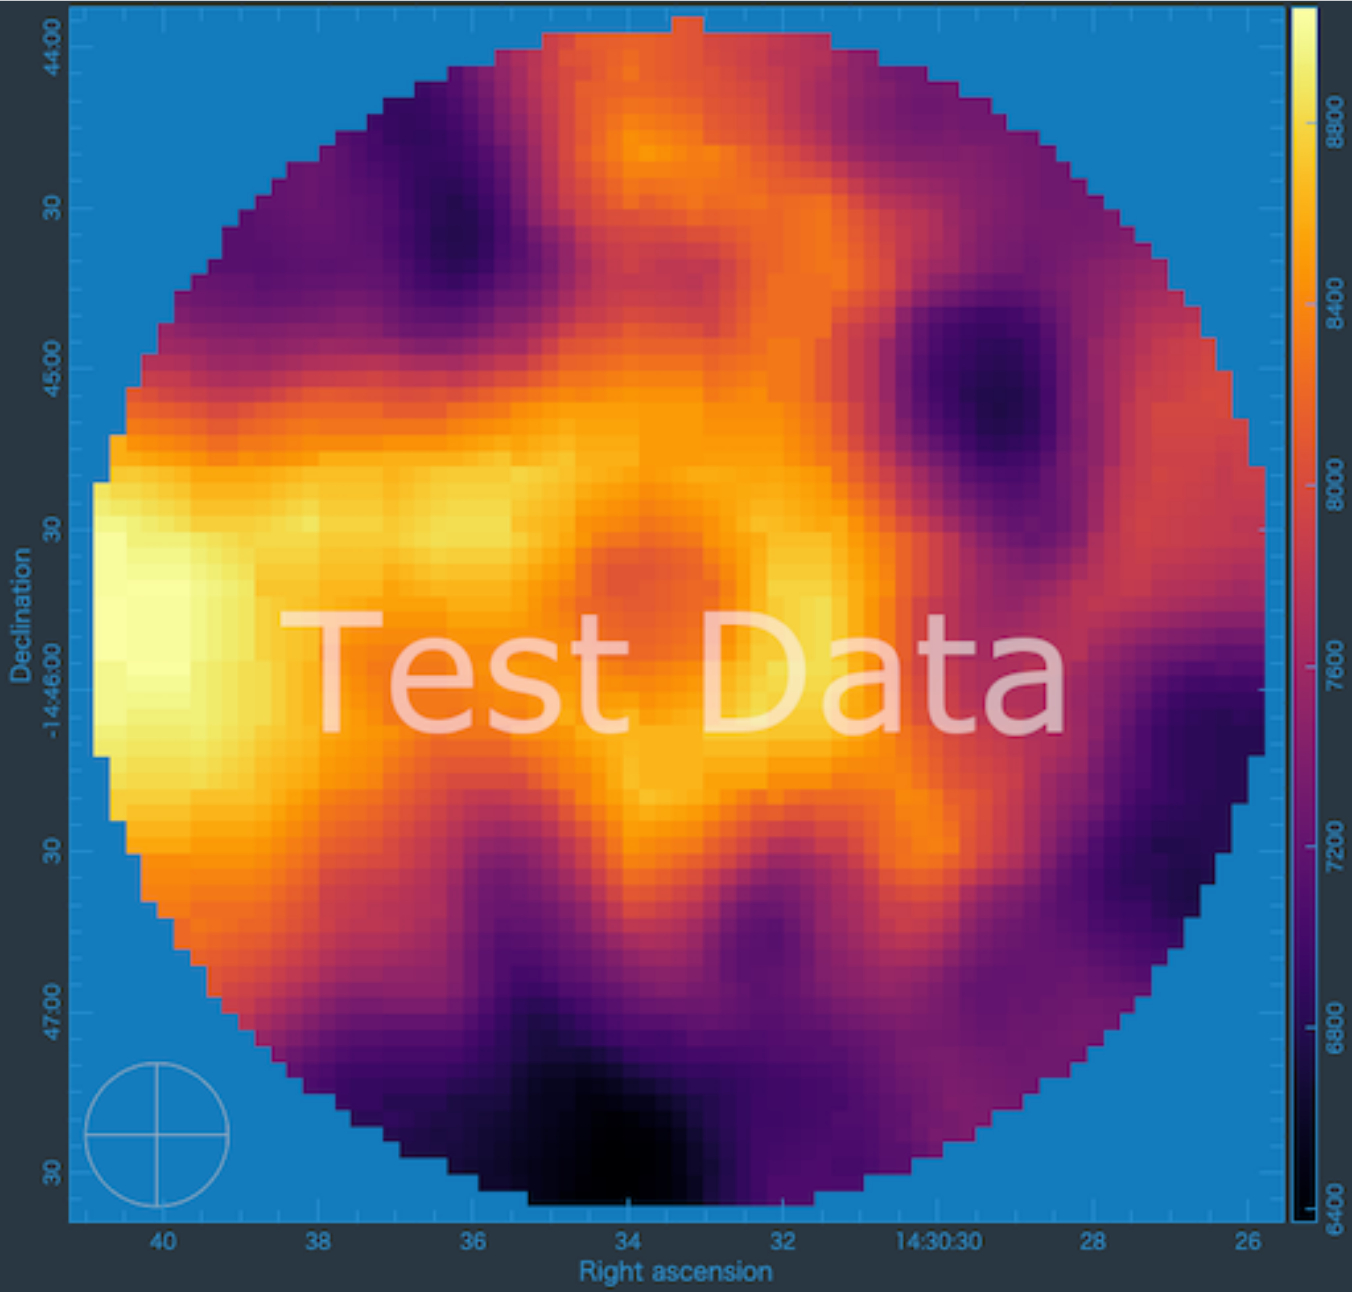
Figure 2: tsdimaging imaging result of a regional map observed at ALMA Band 6, visualized with CARTA. Credit: Masumi Shimojo, NAOJ
[click to enlarge]
Figure 3: 13-second video animation of the regional maps obtained during a ~1 hour observation. The ring-like feature at the center is the sunspot seen at ALMA Band 6. Credit: Masumi Shimojo, NAOJ
[click to enlarge]
CASA supports ALMA Solar Total-Power Fast Regional Mapping (FRM) observing mode since version 6.4. Parameter 'timerange' was added to Single-Dish task tsdimaging for this purpose. Here we summarize the history of its development.
The main scientific goal behind this apparently anodin parameter addition is to observe local dynamic phenomena (e.g. solar flares) in the solar chromosphere. These phenomena not only have angular sizes significantly larger than ALMA antennas' primary beam at any ALMA frequency band, but also vary on timescales typically shorter than one minute. To observe their variations, the region of interest must therefore be mapped within a few tens of seconds. This precludes the use of ALMA's pointed mosaic observing mode, which, despite enabling observations to cover a field of view wider than the primary beam, is too slow. Instead, ALMA repeatedly maps the region of interest using the on-the-fly observing technique, where the signal is continuously integrated while each antenna of ALMA's Total-Power Array moves along a pattern covering the region, and then sampled at extremely short time intervals (1 millisecond). The pattern is either a "double-circle" pattern, or a Lissajous pattern.
From the off-line data processing perspective, one must have a way to precisely identify which data belongs to which regional map. Ideally, some metadata (e.g. a sub-scan number) would have been recorded at observing time. This approach was rejected due to the time overhead of starting and stopping the antenna motion at the start and end of each sub-scan. Instead, test observations were conducted and it was verified that ALMA is capable of executing Fast Regional Mappings in constant time with high accuracy, making it possible to identify the regional maps by time windowing - this requires the 'timerange' parameter.
By-products:
- A longstanding bug in the "select data by time" feature of the casacore library was uncovered and fixed, benefiting the whole CASA code base.
- A bug in ALMA's online control software was uncovered during a test observation and fixed.
The first publications using data obtained with ALMA's Fast Total-Power Regional Mapping observing mode are expected to become available by the end of this year.
Acknowlegements: We thank Elizabeth Humphreys from the ALMA team for authorizing the use of ALMA test data, Masumi Shimojo (NAOJ) who provided and processed the test data, Takeshi Nakazato (NAOJ) and Bjorn Emonts (NRAO) who coordinated the writing of this article.
AstroHACK: Holography Antenna Commissioning Kit
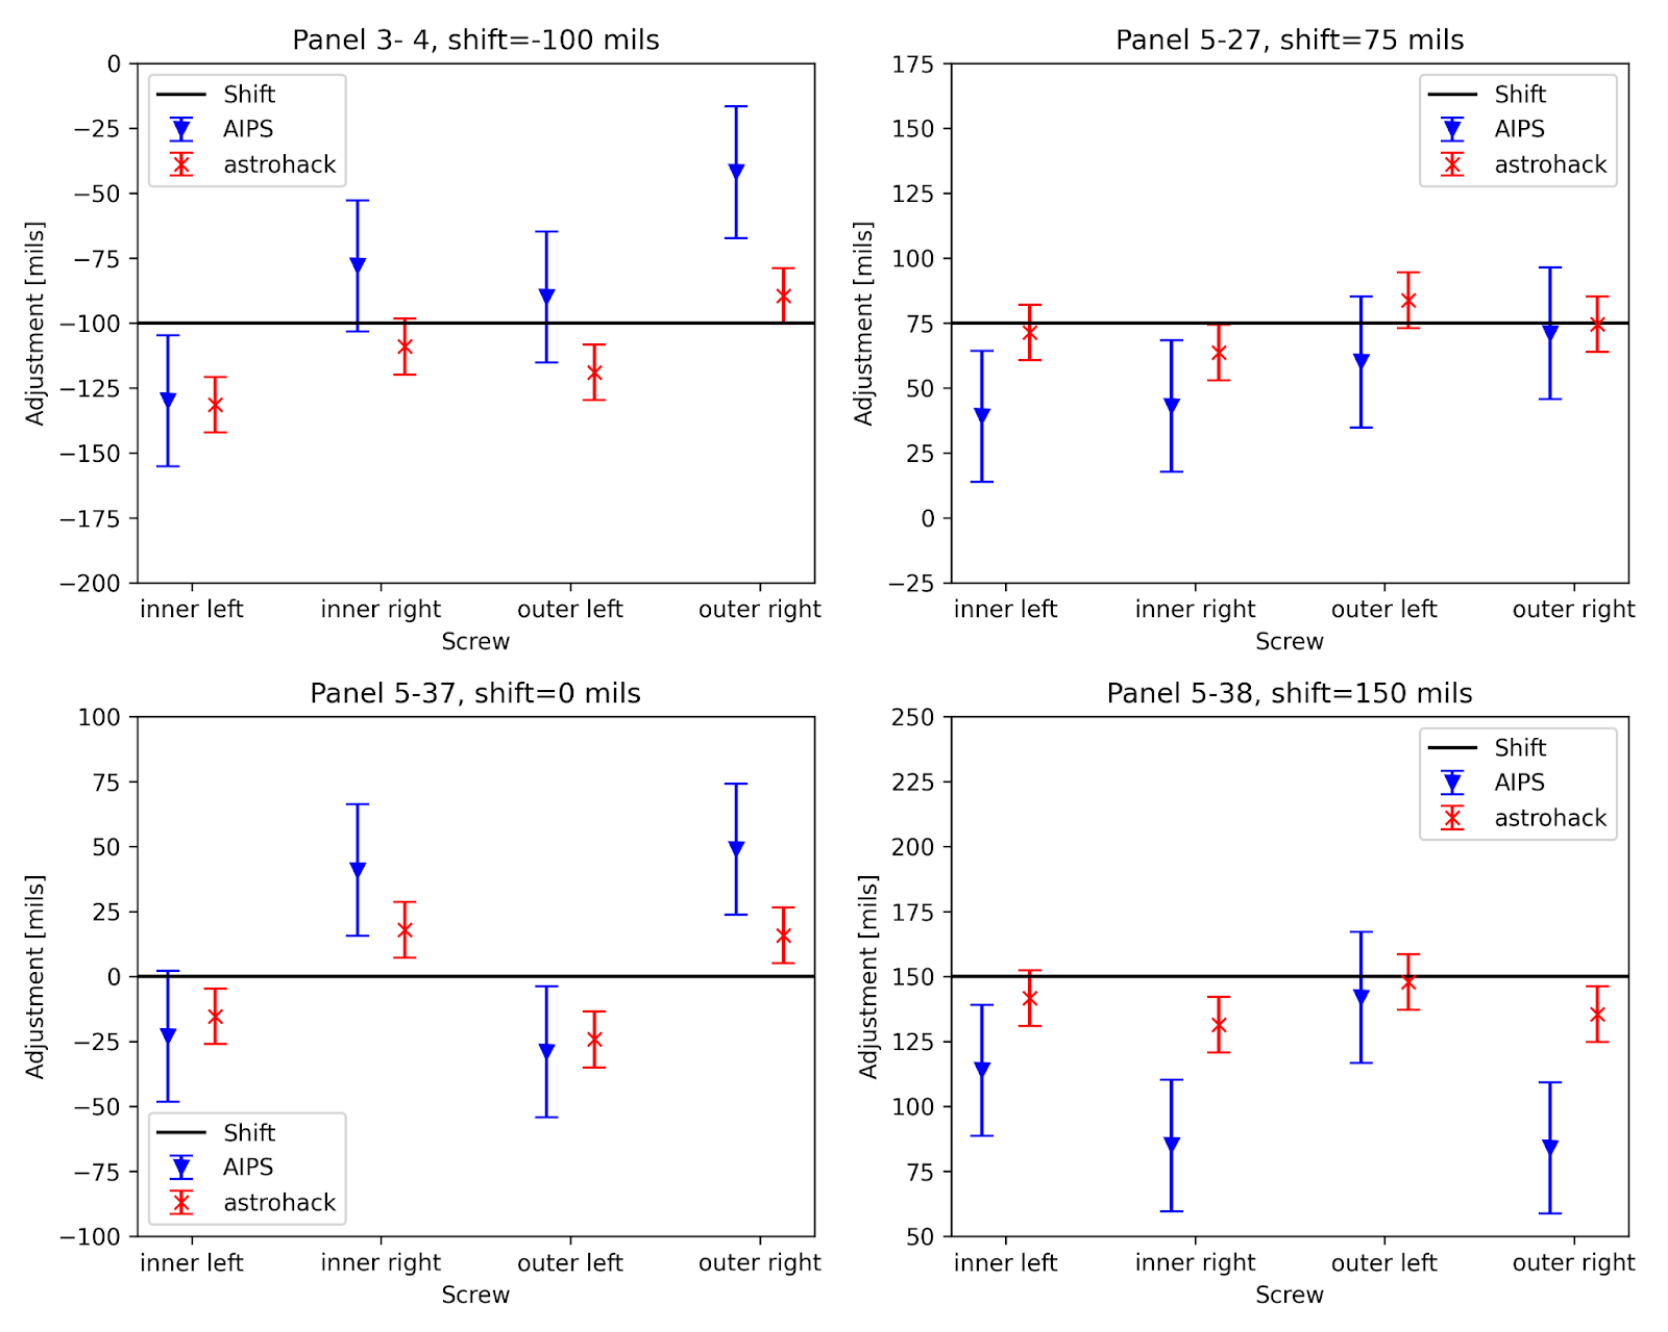
Figure 1. Screw adjustments (in milli-inches) for four panels of VLA antenna EA25. The black line represents the known truth for the panel, which was obtained by taking holography measurements, shifting the panels by a known amount, and then taking another set of measurements. The error bars are given by calculating the standard deviation of 10 panels that are adjacent to the shifted panels. Panel 5-37 was not shifted between measurements.
[click to enlarge]
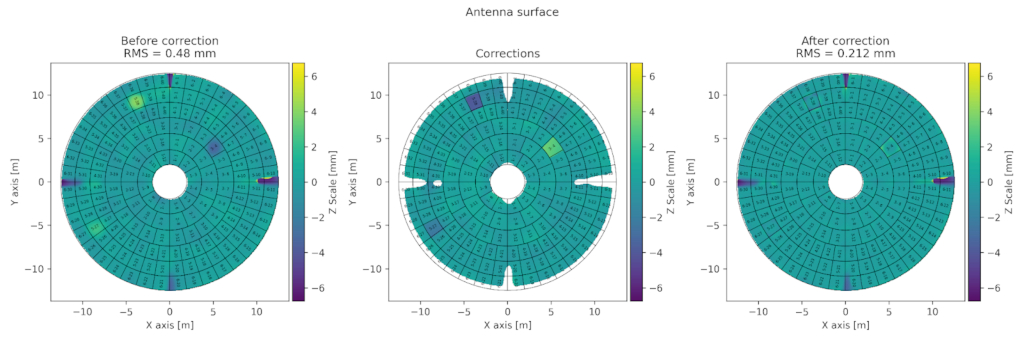
Fig. 2: Panel plots of VLA antenna EA25 where three panels were shifted.
[click to enlarge]
AstroHACK (Holography Antenna Commissioning Kit) beta release v0.1.6 is now available. It is an open-source Python package that produces antenna aperture images and antenna panel adjustment corrections from calibrated holography measurement sets all within a Jupyter notebook (AstroHACK can also be used in a Python script or iPython session). Installation is easy by using
pip install astrohackin a Python 3.8-3.10 environment on macOS or Linux.
Even though CASA/Pipeline users will not have to use AstroHACK, it will still have a major impact on the quality of the data they reduce. For example, the panel adjustments completed in 2000 more than doubled the high-frequency sensitivity of the VLA.
AstroHACK is developed using the CNGI (CASA Next Generation Infrastructure) Software Framework. Parallel execution is achieved using Dask and efficient single-threaded performance by making use of Numba or Vectorized NumPy code. Data in the MeasurementSet is accessed using Python-casacore and results are stored using Zarr.
AstroHACK v0.1.6 supports pointed and on-the-fly mosaic far-field holography from the VLA and ALMA. Additional features such as near-field ALMA holography and ngVLA modeling are being worked on.
Concurrent execution is achieved by processing each mapping antenna and spectral window independently. Where holography data processing would take many hours, now it takes 6 minutes on a 12-core workstation.
Not only is AstroHACK fast, it has shown improvements in precision and accuracy over AIPS in initial testing. In Figure 1, the AstroHACK and AIPS computed screw adjustments are given for four panels, of VLA antenna EA25, where the screw adjustments are known. On average, AstroHACK is closer to the true value and has smaller error bars. These improvements are due to improvements in the accuracy of the panel screw positions and panels are now divided into two regions: margins and samples. Margins are not fitted as they might be convolved with nearby panels but are always corrected.
AstroHACK can generate informative panel plots, for example, Figure 2 clearly shows the three panels of antenna EA25 that were shifted in the test data.
Try out AstroHACK today in a Google Colab session.
CASA and CASA-VLBI Reference Papers
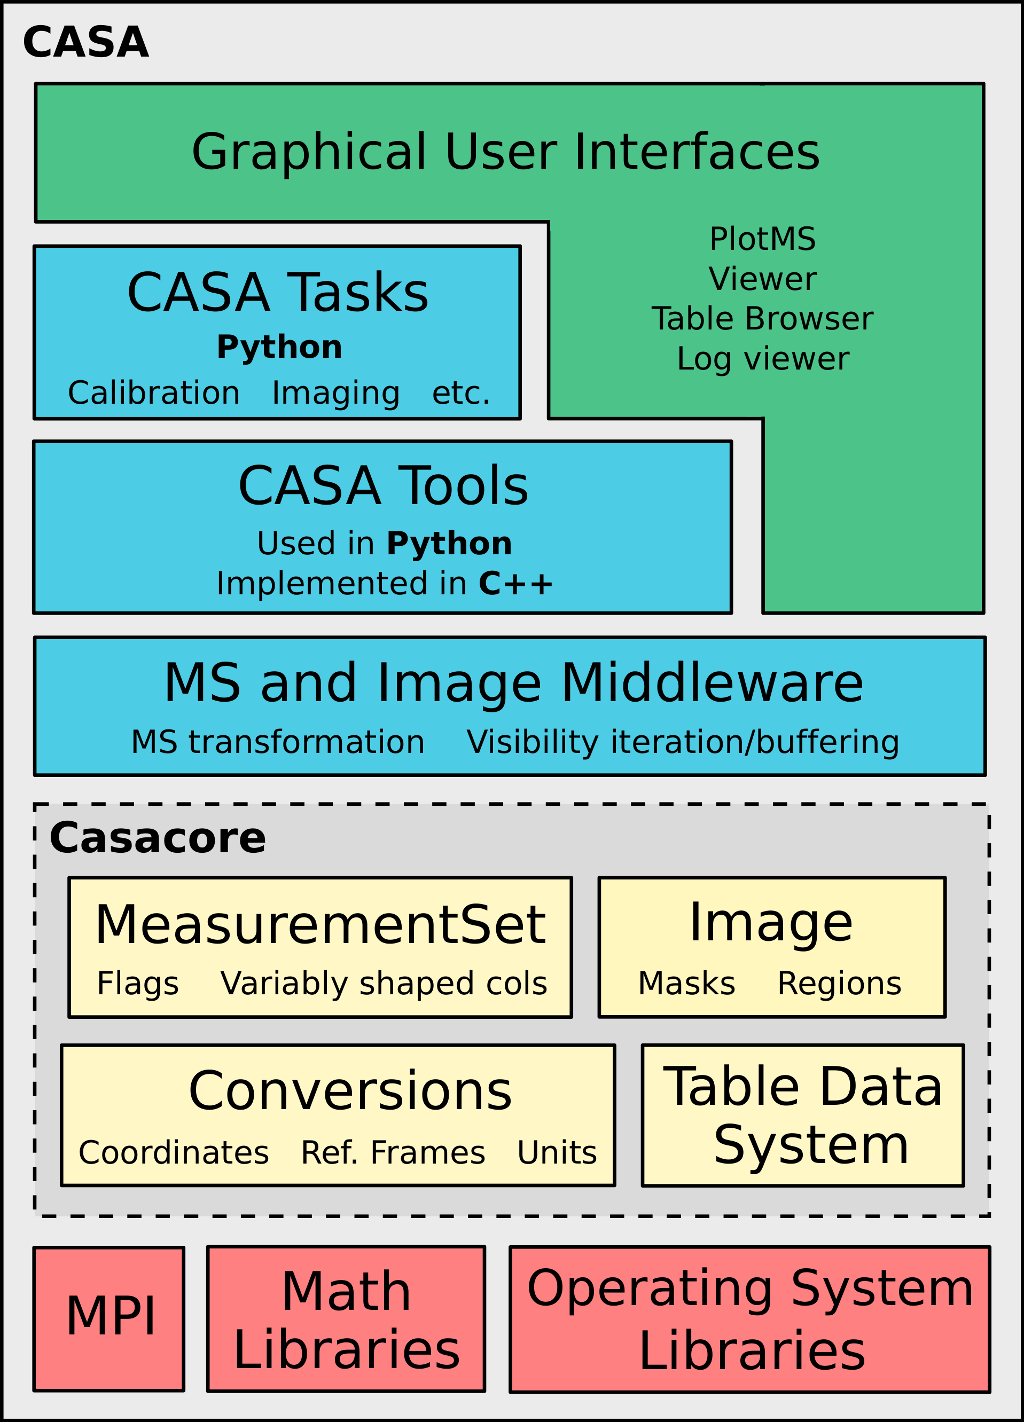
Figure 1. Figure from the CASA paper on the structure of the CASA Code. Layer architecture diagram of the monolithic CASA software package. The various terminology is discussed in the CASA paper.
[click to enlarge]
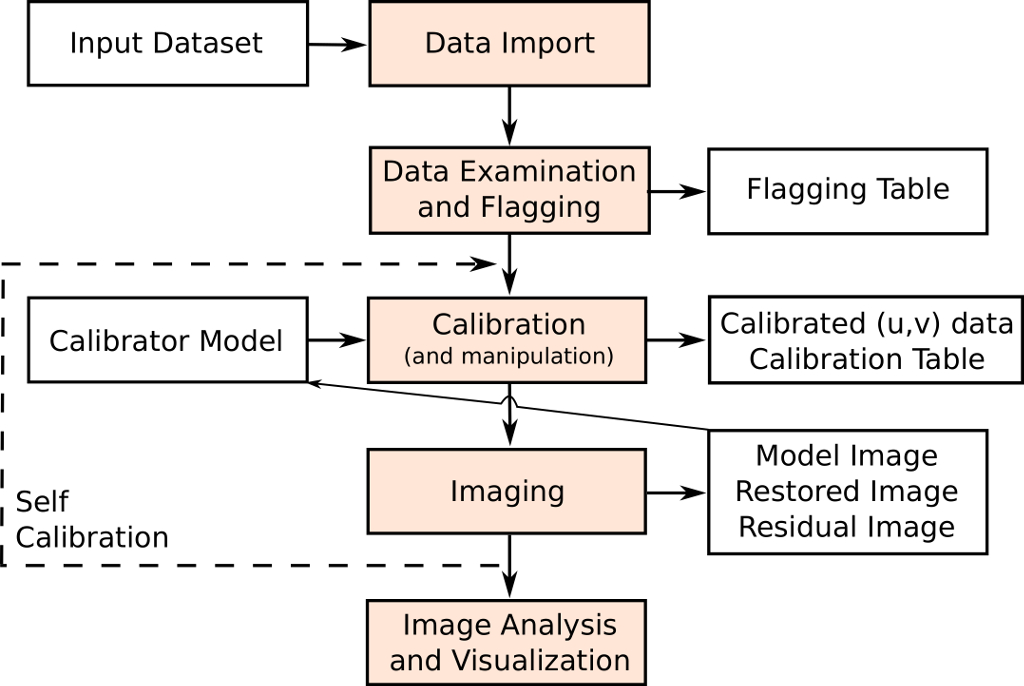
Figure 2. Figure from the CASA paper on the usage of CASA. Flow chart of the basic operations that a general user will carry out in a typical end-to-end CASA data processing session.
[click to enlarge]
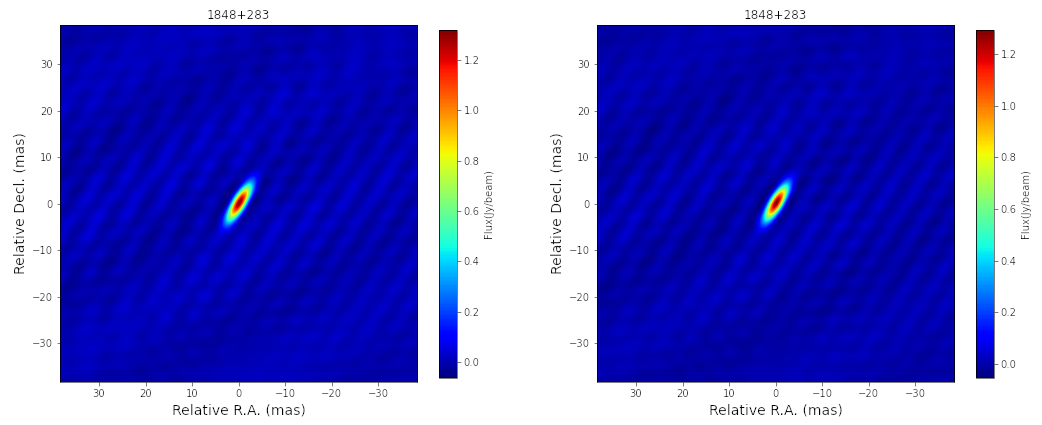
Figure 3. Figure from the CASA-VLBI paper on performance of CASA vs. AIPS. The images of a source from EVN experiment N14C3 processed with AIPS (left) and CASA (right) demonstrate that the results are identical.
[click to enlarge]
Two new CASA reference papers appeared in Publications of the Astronomical Society of the Pacific (PASP) last November. The first one is the CASA Team’s new official CASA reference paper, providing a high-level overview of the CASA software. The second one is a VLBI-specific CASA paper led by the Joint Institute for VLBI European Research Infrastructure Consortium (JIVE) in collaboration with the CASA team. We here give a brief overview of these two publications.
We kindly ask users who use the CASA software or CASA VLBI capabilities in their work to please use these two reference papers for citations.
CASA Reference Paper
The CASA Team, et al. 2022, CASA, the Common Astronomy Software Applications for Radio Astronomy, PASP, 134, 114501 (DOI 10.1088/1538-3873/ac9642)
This CASA paper presents a high-level overview of the basic structure of the CASA software, as well as procedures for calibrating and imaging astronomical radio data in CASA. It is aimed at the general CASA user community, for everyone who wants to familiarize themselves with CASA’s history, structure, usage, scope, development process, and future plans. An introductory overview presents CASA’s history in relation to Casacore and AIPS++, as well as the code’s implementation in relation to Python and C++. This is followed by an extensive summary of the code structure, content and usage, based on the detailed information provided in the official CASA documentation. The paper then briefly addresses how CASA interacts with Algorithm Research and Development that is undertaken at NRAO, as well as with pipelines for ALMA, the VLA, the VLA Sky Survey, and the Nobeyama 45m telescope, which are being developed by CASA stakeholders. The last section of the paper gives a brief preview about ongoing developments for a next-generation CASA and CASA infrastructure.
CASA-VLBI Paper
van Bemmel, et al. 2022, CASA on the Fringe - Development of VLBI Processing Capabilities for CASA, PASP, 134, 114502 (DOI 10.1088/1538-3873/ac81ed)
This paper describes new tasks and functionalities implemented in CASA for the processing of Very Long Baseline Interferometry (VLBI) data. This work was led by JIVE in collaboration with the CASA team. The paper gives an overview of the development and implementation of new tasks to handle fringe fitting and VLBI-specific amplitude calibration steps, and presents a comparison regarding the performance between CASA and AIPS. It also describes how the VLBI capabilities in CASA allow for easy development of pipelines and the use of Jupyter Notebooks, which contributes to raising VLBI data processing to present day standards for accessibility, reproducibility, and reusability. See the following JIVE News article for details.
Featured Image: the Cosmic Anthill
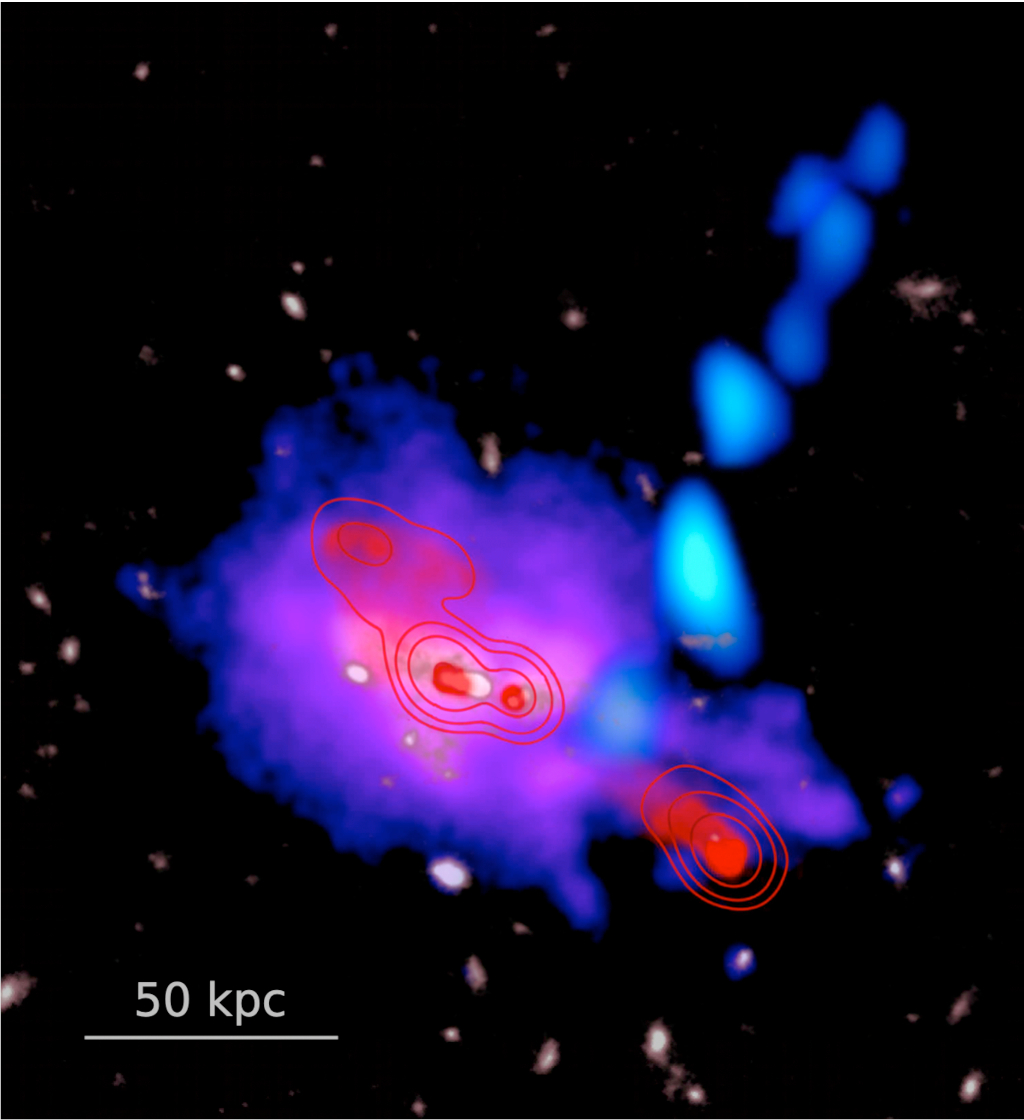
Figure 1. The Anthill Galaxy (z=3.8). Cosmic stream of atomic carbon (blue) detected with ALMA across a length of 100 kpc, accreting onto the giant Ly-alpha halo (purple) that surrounds the Anthill radio galaxy. In red is shown a LOFAR VLBI image of the radio source, with sub-arcsec resolution at 144 MHz. The red contours represent corresponding VLA data at 1.4 GHz. The gray background image shows merging galaxies detected with the Hubble Space Telescope. Molecular gas detected in the center of the Anthill was omitted from this figure for clarity.
[click to enlarge]
The Anthill Galaxy (aka 4C41.17) at redshift 3.8 is one of the most massive galaxies in formation. The Anthill represents a spectacular case of hierarchical galaxy merging within a giant Ly-alpha halo of ionized gas. At its core, the Anthill contains a super-massive black hole that expels powerful radio jets with an ultra-steep spectral index. In the early 1990s, this radio source served as a bright beacon for detecting the faint host galaxy, which at the time was the most distant galaxy known in the Universe.
Recent observations with both the Low Frequency Array (LOFAR) and the Atacama Large Millimeter/submillimeter Array (ALMA) shed a new light on both the black-hole activity and cosmic growth of this massive galaxy. Using Very Long Baseline Interferometry (VLBI), LOFAR studied the ultra-steep spectrum radio source down to 144 MHz at sub-arcsec resolution, with matching 1.4 GHz data from the Karl G. Jansky Very Large Array (VLA) (Fig. 1). This spectacular feat confirmed that the radio jet is aligned with both the giant ionized gas halo and the distribution of merging galaxies, and that the location of the steepest radio emission coincides with the Ly-alpha emitting gas in the halo. This indicates that the radio jet vigorously interacts with the surrounding circumgalactic medium.
On an even larger scale, but perpendicular to the radio axis, ALMA observations of atomic carbon showed that the Anthill is fed by a cosmic stream of cold molecular gas, which is the raw material for star formation. This cosmic stream supplies the Anthill with enough molecular gas to fuel its long-lived star-formation rate and potentially double its stellar mass over the next Giga-year (i.e., by redshift 3). This process of cosmic accretion may represent a main mechanism by which distant massive galaxies like the Anthill grow. The LOFAR and ALMA observations reveal that the evolution of the Anthill Galaxy is intimately linked to its large-scale gas-rich environment.
The CASA software was instrumental to these discoveries. For the ALMA data of the cosmic stream, a careful separation of the strong radio continuum emission from the weak line-emission of atomic carbon was performed using various versions CASA with ALMA imaging pipeline, to verify the reproducibility of the results with changes in the continuum subtraction. The ALMA results remained robust, which also highlights the reproducibility of the CASA and pipeline software across release versions. While the LOFAR VLBI data were primarily processed using dedicated LOFAR software, CASA was instrumental in the joint LOFAR-VLA data analysis. CASA VLBI capabilities have now matured enough to support data processing of VLBI data.
Automated self-calibration available for ALMA and VLA
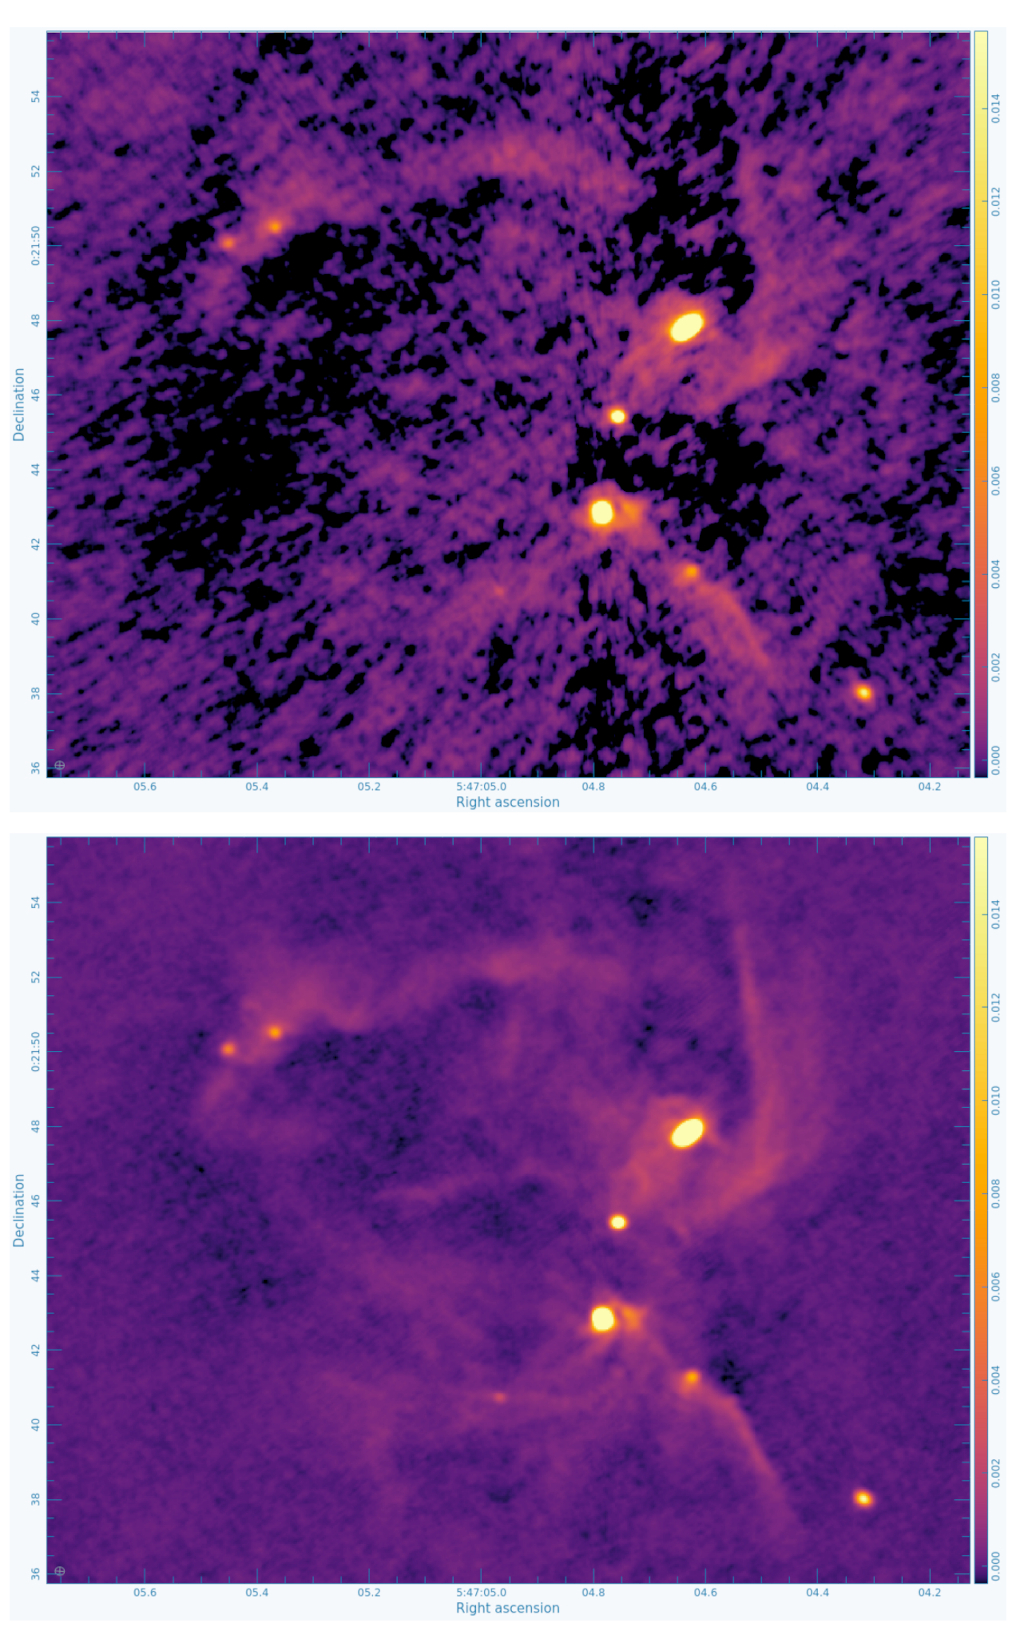
Figure 1. ALMA Band 6 (1.3 mm) images of the NGC 2071 IR star forming region from ALMA project 2018.1.01038.S (Cheng et al. 2022). The top image is without self-calibration, while the lower image is from the automated self-calibration within the pipeline.
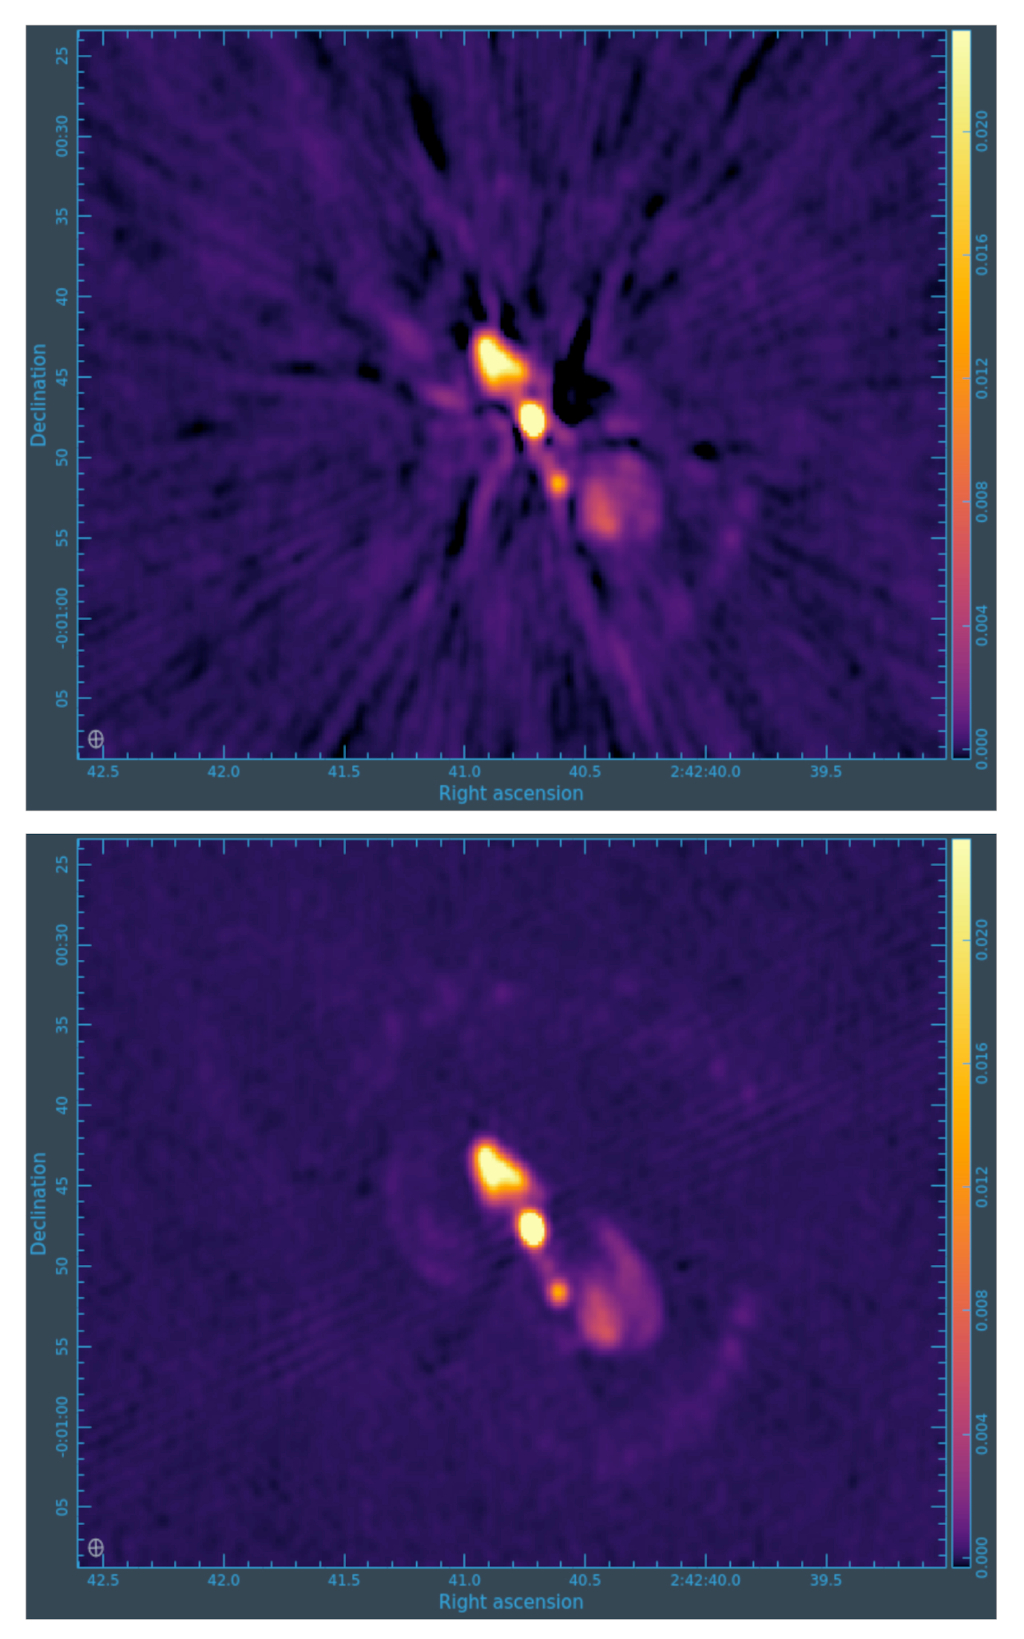
Figure 2. VLA K-band images (1.3 cm) of the galaxy NGC 1068 from project 18B-163 (Chiaraluce et al. 2020). The top image is without self-calibration, while the lower image is from the automated self-calibration within the pipeline.
The Science Ready Data Products (SRDP) project and the NRAO pipeline team are excited to announce the addition of automated self-calibration to the ALMA and VLA imaging pipelines. We are providing users with a preview of this capability prior to the normal fall pipeline release. The automated self-calibration capability is immediately available through the ALMA User-Defined Imaging capability from the NRAO archive. Thus, self-calibration of the science targets will be attempted for any qualifying dataset that is imaged with this service. Phase-only self-calibration is performed using the continuum data, and solutions are applied to the spectral line data as well. Users will be provided the continuum and spectral line images with and without self-calibration applied to enable them to evaluate the impact of self-calibration.
The initial automated self-calibration capability is available for single pointing observations only and is expected to perform well for modest to high signal-to-noise data. Future extensions to self-calibration will include mosaics and better performance for long baseline configurations. We note that self-calibration has the greatest impact on the continuum data and the effect for spectral line data is generally quite modest (unless the spectral lines themselves are extremely bright). Further documentation of the capability is provided on the NRAO science pages.
We are also providing the CASA 6.5.3 package with the pipeline included so that users are able to explore this capability on their own. While the imaging service through the NRAO archive only supports ALMA at present, the pipeline task itself supports self-calibration of VLA data. Therefore, users can use this package to run the VLA imaging pipeline with self-calibration if desired. We emphasize, however, that this package is only validated to support the ALMA User-Defined Imaging capability and VLA imaging. Any other data processing, i.e., standard calibration of ALMA and VLA data, should be performed using the observatory recommended CASA versions. If users have any questions regarding the pipeline or imaging service, they are encouraged to contact the NRAO helpdesk (Topic: VLA, Department: VLA pipeline for VLA queries and Topic: Data Products, Department: ALMA Data Products for ALMA queries).
The development and implementation of self-calibration for the pipeline was a joint effort between the NRAO SRDP Project, the ALMA Pipeline Working Group, and the ALMA and NRAO pipeline development teams.