VEGAS Spectrometer Bank to Bank Variations Resolved
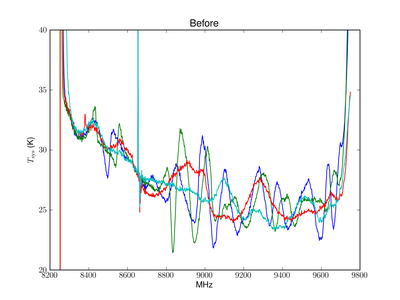
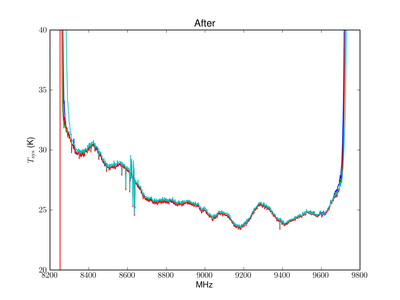
We believe we have definitively isolated the cause of the VEGAS bank-to-bank variations in system temperature and line intensity. This has been traced to excess crosstalk (signal leakage) between the two polarizations (X and Y, or L and R) processed by the same VEGAS Analog IF Module. As an interim solution, we have reconfigured VEGAS to only use one polarization in each of the eight IF modules. This means that in the near term, only four dual-polarization banks(spectrometers), supporting up to four dual-polarization beams, or 32 spectral windows, will be available (see the table below). The Astrid config_tool will automatically route signals to use these banks, so no changes should be required for existing Astrid scripts (although scripts requiring more then four banks will fail to validate at this time). The one exception is the (rare) case where an Observer may have requested specific banks be used; currently only A,C,E,G are available.
Polarization observations should now be possible with VEGAS. However, polarization observations have not yet been tested and we are willing to schedule such observations on a shared-risk basis.
A longer term solution that will restore the disabled banks is expected to be complete in the early fall before the winter high frequency season begins.
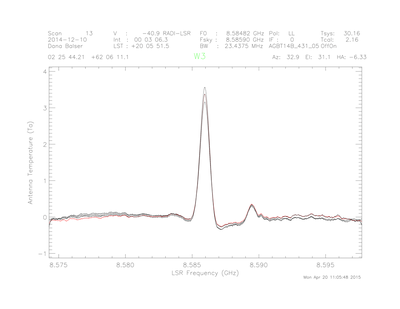
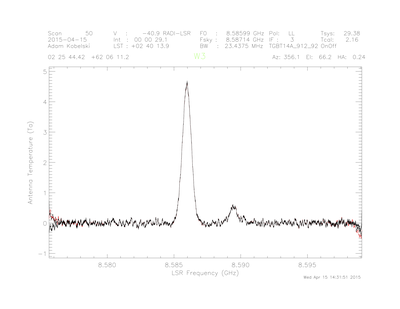
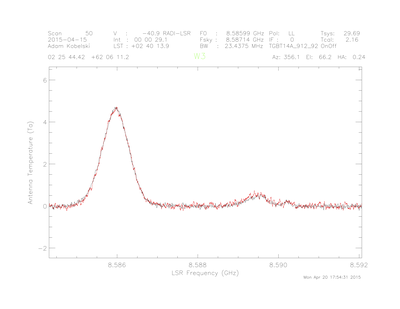
The magnitude of the problem, and the improvement with the new configuration is shown in the accompanying figures. (Click on the figure caption to view a full size version of the figure.)
Observers who followed the suggested best observing practices should be able to calibrate their data to within a few percent accuracy.
If you have further questions we encourage you to contact your project's assigned friend and Toney Minter (tminter -at- nrao.edu).
| Beams | Spectral Window per beam | Number Spectrometers Allowed per beam |
|---|---|---|
| 1 | 1 or 8 | 1, 2, 3 or 4 |
| 2 | 1 or 8 | 1 or 2 |
| 4 | 1 or 8 | 1 |


Connect with NRAO