VLASS Quick Look Images
The VLASS Quick Look (QL) images use a relatively simple imaging algorithm that results in limits on the accuracy of the images, but they should still be adequate for most science use cases. Over the next few years, they will be superseded by the more accurate Single Epoch continuum images.
Link to the Quick Look images at NRAO
Quick Look images are now available from the VLASS archive image cache for the whole of Epochs 1 and 2 (divided into the VLASS1.1, VLASS1.2, VLASS2.1 and VLASS2.2 campaigns), the first half of Epoch 3 (VLASS3.1) and for the Pilot Survey by following the link above. In addition, deprecated images (without flagging for ghost removal) may be found in the "old_image_versions" directory, and miscellaneous test and QA rejected images may be found under "Test".
Link to the Quick Look images at CADC
The Quick Look images are also available from CADC by following the link above, or by selecting "Advanced Search" and the "VLASS"collection on the CADC home page. The CADC archive is updated within a few days of new data appearing at NRAO. CADC also supports VO services for VLASS images such as SIA and SODA.
Link to Quick Look Catalogs and the cutout server at CIRADA
Catalogs and a cutout service for the QL images at CADC have been developed by the Canadian Initiative for Radio Astronomy Data Analysis (CIRADA) and may be found at the link above.
Please read the guide below before using VLASS Quick Look images for scientific purposes.
Guide to VLASS Quick Look Images
The following applies to QL images from Epochs 1 and 2 of VLASS, and is subject to modification as the images are examined further. Users are referred to VLASS Memo #13 (obtainable from the VLASS Memo collection of the NRAO Library) for more technical details. We expect these limitations will be significantly mitigated when more accurate Single Epoch images are produced.
Positional Accuracy: In VLASS Epoch 2 and later, and in corrected Epoch 1 images (VLASS1.1v2 and VLASS1.2v2), the positional accuracy of a typical source is 0.2 arcsec, limited by system noise and phase errors introduced by the troposphere and ionosphere.
[In the original, now deprecated, Epoch 1 VLASS quick look images the positional uncertainty is ≈ 0.5” at Dec > −20, increasing to ≈ 1” at Dec −40◦ . This was primarily due to uncorrected wide-field imaging effects that were later fixed. Please be aware though that the uncorrected Epoch 1 images are still being served at data.nrao.edu.]
Flux Density Accuracy: The flux density accuracy for the first campaign of the first epoch (VLASS1.1) and subsequent VLASS campaigns (VLASS1.2, VLASS2.1, VLASS2.2, VLASS3.1 and VLASS3.2) differ, with VLASS1.1 typically worse (due to a problem with the antenna positions that was fixed for 1.2 and subsequent campaigns). For objects in VLASS1.1 with flux densities below ≈ 1Jy, the peak flux densities are systematically low by ≈ 15%, and the total flux densities by ≈ 10%, with a systematic scatter of ≈ ±8%. Above 1 Jy the flux densities can be very unreliable and should not be used. In VLASS1.2 onwards, the corresponding offsets in flux density are about 8% low for the peak flux densities and 3% low for the total flux densities, with no difference in these accuracies for >1 Jy sources.
Sensitivity to Extended Emission: The shortest baselines covered by S-band B-array are approximately 58" (see the Largest Angular Scale (LAS) in Table 3.1.1 in the Observational Status Summary), but it is unknown how much flux density is recovered on those scales, For complex sources, the recovery of extended emission will vary with morphology. In addition, the QL images were made by combining data over the full 2–4 GHz band during imaging, implying a factor of two in scale over the band with an uncertain impact on the LAS in these wideband images. We have no quantitative assessment at this time on the sensitivity and accuracy of the VLASS QL images to extended structure, and we caution users to keep this in mind when using these images.
Ghost Artifacts: There were errors during observing that caused faint “ghost” copies of sources to appear at multiples of 1 or more field offsets (178.74" in most Tiers) in RA. Even if the ghosts are to faint to see in an image, they will rob the true source of flux density, biasing the flux measured flux density low. The ghost remnants were found in observations made in the Pilot, VLASS1.1 before 2017-Nov-15, and in VLASS1.2 between 2019-Mar-13 and May-13. The VLASS1.2 ghost effects were of a different nature to those in the Pilot and VLASS1.1, and have been successfully removed in reprocessing. Where we have been able to detect ghosts in the Pilot and VLASS1.1 data at >5-sigma, the data have been reprocessed to remove the ghosts. Faint (<5-sigma) ghosts may still be present in Pilot and VLASS1.1 data taken prior to 2017-Nov-15.
Image artifacts
The algorithms used to generate the Quick Look images were designed to run quickly, in particular to allow searches for transient radio sources. This means that, in addition to the minor issues described above, some images are affected by systematic failures in the clean algorithm and/or poor phase calibration.
Bright sources: there is a systematic variation in the PSF across a VLASS mosaic that is not allowed for in the clean. Thus, the presence of bright (> 100 mJy) sources with high S:N sidelobes can sometimes cause the clean algorithm to diverge. For the most part these fields are found during QA and typically they are placed in the QA rejected category if the ratio of the residual from the clean to the RMS over the remainder of the image exceeds 10:1, but in general users should exercise caution when extracting detections of faint objects in the vicinity of bright ones, as false detections and/or distorted morphologies are likely to be found.
Phase errors: no self-calibration is applied to the Quick Look images. Thus, their dynamic range is very dependent on observing conditions. These can lead to a false impression that an object has a particular morphology or size. As the phase errors will persist over a large fraction of a tile, the keys to identifying these is that all point-like sources share a morphology, and the distortions around the point sources are asymmetric in nature. Quantitatively, the near-field dynamic range 8-arcsec (~3 beams) from a point source (defined as the ratio of the peak brightness in the center to the magnitude of the largest artifact on an 8" radius circle) ranges from about 10:1 to 100:1 in the Quick Look images. At the lower end of this range, particularly when using a logarithmic or histogram stretch in a viewer it is easy to mistake such artifacts for real morphological features. An example of such an unusually poor image is shown in Figure 1. Another problem is that poor phases in one epoch can lead to mis-identifications of transients when comparing to an epoch with better phase correction. Examples of tiles with poor phases are T31t03, T31t04 and T32t02 in Epoch 1.1.
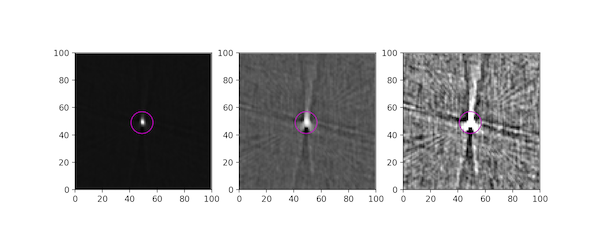
Figure 1: a point source in a tile with bad image quality. Left: a linear stretch from the image minimum to maximum, center: a logarithmic stretch from minimum to maximum, and right a +/-5-sigma stretch, where the rms, sigma, is measured in the image far from bright sources. Note the characteristic three-fold pattern, asymmetric about the source center. The magenta circle shows the 8" radius used for calculating the near-field dynamic range. In this example, the value of the near-field dynamic range is 13.
Users are encouraged to submit questions and comments to the VLASS Department of the NRAO Helpdesk to improve the usability of this document.


Connect with NRAO