VLA Pipeline Bug Affecting Flux Density Scale for Multi-band Data
In August 2022, we uncovered a software bug that can affect the flux density scale of multi-band data calibrated by the VLA pipeline. This issue is present specifically for datasets where the fitorder is greater than 2 in the task hifv_fluxboot/hifv_fluxboot2 (see ‘By Task’, Stage 11 in the current VLA pipeline weblog). If your data set was single-band or the fit order in your multi-band data set was less than or equal to 2, your calibrated data are not impacted by this bug.
We emphasize that this bug is in the pipeline and not in CASA itself; manually calibrated data are not impacted by it. The two pipeline versions with this bug are CASA 6.1.2 (pipeline version 2020.1.0.36) and CASA 6.2.1 (pipeline version 2021.2.0.128). These CASA versions were in use between 10 December 2020 to September 2022.
The issue results from the pipeline call to the CASA task setjy not propagating the 3rd and 4th order spectral terms to the setjy parameters. Thus, the flux density for the complex gain calibrator was not getting properly set as a function of frequency. This inaccuracy is then transferred to the flux density scale of the calibrator(s) and science target(s).
The severity of the issue on a given dataset depends on the flux density vs. frequency behavior of the complex gain calibrator, with the impact ranging from negligible to a factor of 1.5 error in the flux density scale. If the complex gain calibrator has a simple spectrum, i.e., dominated by a power law decrease with increasing frequency, the impact may be minimal. However, for a more complex spectral shape, particularly when the behavior is different at low vs. high frequencies, the propagated error in the flux density scale is likely more severe. We have generally seen the largest discrepancies in the lowest frequency bands of multi-band data (L and/or S-bands). The most severe cases can show a 'staircase' pattern in the plots of calibrator flux density vs. frequency in the weblog for the hifv_plotsummary task (Stage 17). For less severe cases, users would see spread in gain amplitudes across all antennas in the Gain Amplitude vs. Time plots, and they would see similar issues in the Gain Amplitude vs. Frequency plots with the gain amplitudes likely changing with frequency. Examples of the issue are given below.
A fix for this bug is available in CASA version 6.4.1 with pipeline version 2022.2.0.64. We will be reprocessing the affected data as resources allow and re-ingesting the fixed calibrations into the archive. Users requiring fixed data on a shorter timescale will have the ability to reprocess their data with the new CASA+pipeline package when it is available. Manual processing of data (without using the pipeline or its tasks) is not affected by this bug. Users are encouraged to contact the NRAO helpdesk (https://help.nrao.edu) if they have further questions about this bug, require more information, and/or need help to assess the severity of the bug's impact on their data.
More Details and Examples:
In fluxboot stage, when 3 or 4 spectral index coefficients are determined, this pipeline bug causes only the first 2 terms to be used when setting the calibrator flux density scale. For instance, the spectral index coefficients table from fluxboot stage may show:


and the setjy call in the pipeline should be:
setjy( vis='finalcalibrators.ms', field='1616-181', spw='2~161', selectdata=False, timerange=, scan=, intent=, observation=, scalebychan=True, standard='manual', model=, modimage=, listmodels=False, fluxdensity=[0.25255, 0.0, 0.0, 0.0], spix=[-0.11554, -0.33331, -0.07365, 0.42120], reffreq='14630590975.918522Hz', polindex=[], polangle=[], rotmeas=0.0, fluxdict={}, useephemdir=False, interpolation='nearest', usescratch=True, ismms=False )
However, the bug causes only the first 2 terms to be used:
spix=[-0.11554, -0.33331]
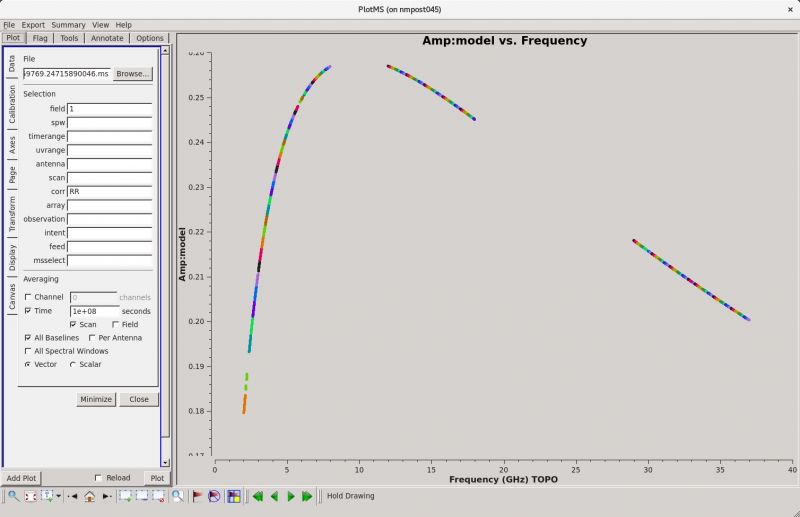
Below are images comparing the gain calibrator model column after running setjy with 2 and 4 terms (these were manually plotted, i.e., were not generated in the pipeline weblog).
Calibrator model when only 2 terms are used:
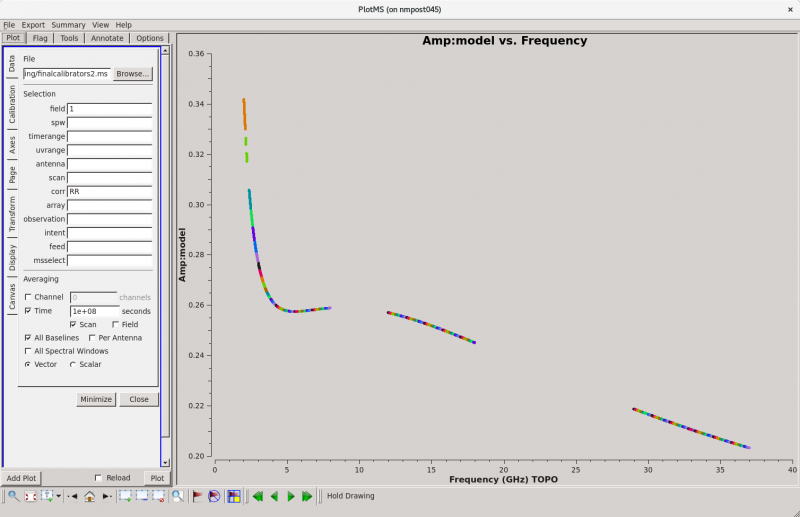
Calibrator model when 4 terms are used:
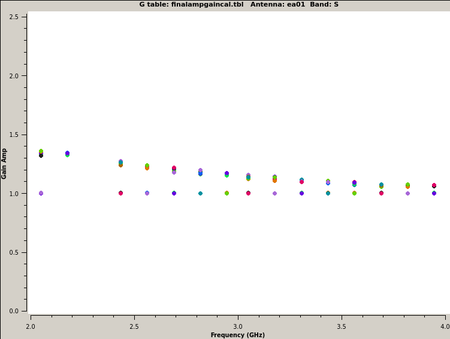
One symptom of the bug is a large a spread in the gain solutions for the most affected bands, which will appear on all antennas.
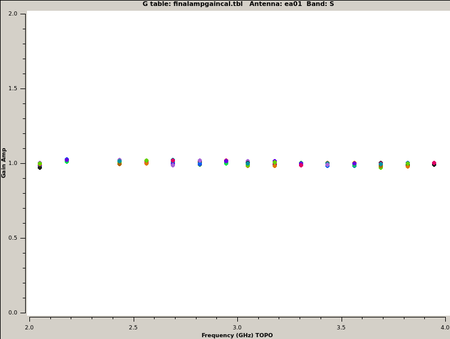
Gain amp vs. frequency when only 2 terms are used:
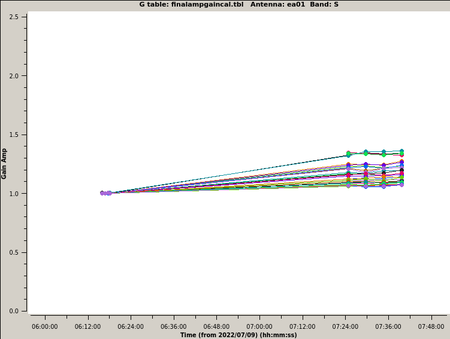
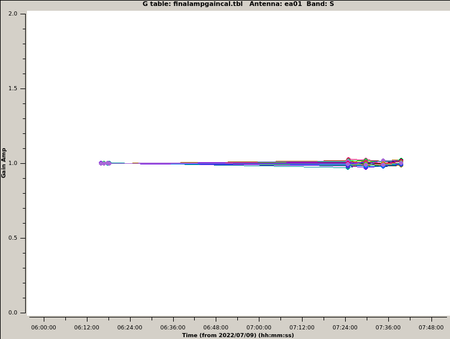
Gain amp vs. time when only 2 terms are used:
Gain amp vs. frequency when 4 terms are used:
Gain amp vs. time when 4 terms are used:
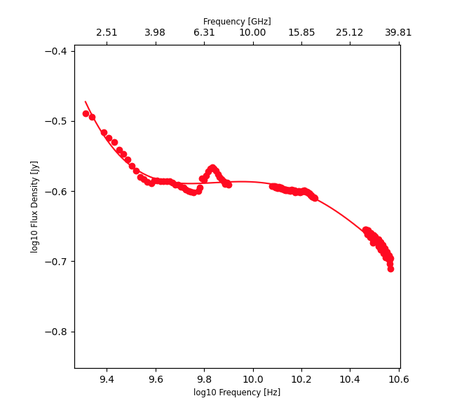
In the example below, the S-band data are forced into a positive slope when it should be negative. This can result in the corrected amplitudes being discontinuous between spectral windows, resulting in what looks like stairs/steps.
Spectral index fit using all 4 spix terms. In S-band (below 4 GHz on top X axis), the slope is clearly negative:
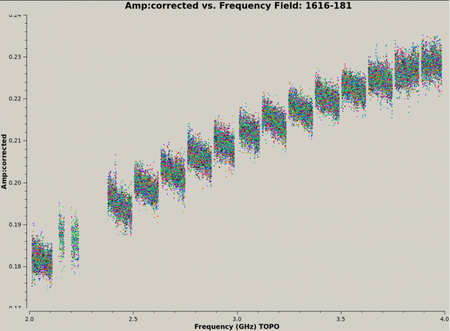
Corrected amp. vs frequency for the phase calibrator in S-band. Slopes within each spectral window are negative, but the overall slope across the band is positive because the model only used 2 spix terms instead of 4:


Connect with NRAO