VLA Atmospheric Delay Problem
Introduction
The VLA software system uses CALC (version 9) to calculate the delays for each antenna that are provided to the WIDAR correlator to apply during correlation. One of the components of the calculated delay is the atmospheric delay. Control of how (and whether at all) the atmospheric delay is calculated within the CALC code is contained both within the code itself, and through use of external environment variables. CALC also calculates atmospheric refraction, which is used to modify the pointing of the antennas. Because of the way the code is structured, it is difficult to extract the various elements of delay, and refraction, separately for external use. There are tables in the Science Data Model (SDM) which have columns for these various elements, including the DelayModel and Pointing tables.
During the summer of 2016, we began investigating methods of separating those elements out within CALC. It proved difficult, so we started pursuing a solution where the atmospheric delay was pulled entirely out of CALC; i.e., we would turn off the internal CALC application of the atmospheric delay, and calculate it in a separate function (and similarly with refraction). We could then properly populate at least the Pointing table in the SDM. On August 9, 2016, after extensive testing of this new implementation, we started using it in the production software at the VLA. At the time we were in the B-configuration of the array, so did not have the longest baselines available to us. However, we were attempting to get the SDM Pointing table correctly filled in for the VLASS pilot observations, which were only occurring in the B-configuration, and all indications from our testing were that the change was working correctly, so we went ahead without testing on those longest baselines.
As we moved into the A-configuration in mid-September, it became apparent from pointing and antenna location observations (which we always do when we move antennas) that there were problems at low elevations, almost certainly caused by this new implementation of the atmospheric delay. We immediately began investigating potential solutions, and tried many different ones (including changing the environment variables, the sign of the antenna height correction, the sign of the entire atmospheric correction, and the scale height of water vapor in the atmospheric model). In the end, we determined that the internal CALC model had never been completely turned off, so that the atmospheric delay was getting doubly applied (both the internal CALC model and our new external one were being added to the total delay). After many attempts at modifying the code to turn off that CALC atmospheric delay, we could no longer wait further, so we returned to the original method of using only the internal CALC atmospheric delay model (turned off the external model). That was put into the production software on November 14.
The bottom line is that for all SBs observed on the VLA between those two dates (August 9 and November 14, 2016), the atmospheric delay term was in error, and the visibilities are affected. The main end effect is that sources will be displaced from their positions, in the direction of elevation, and this displacement is a function of elevation, maximum projected baseline length, and distance from your complex gain calibrator, all of which are functions of time. It is also a function of frequency, but only in the sense that the magnitude of the offset in terms of number of synthesized beams will scale with frequency, since the size of the synthesized beam is a function of frequency. The effect is a strong function of elevation (see below), so if your sources are mainly at elevations above 20 degrees, the effect should be small unless your source-calibrator separation is large. Since it is such a strong function of elevation, for lower elevations two effects will be seen - the offset mentioned above, and a smearing of the source in the direction of elevation, because of the changing offset as a function of time, as the source changes elevation. For short observations (minutes), this smearing should be small, but for longer ones (where the source is at low, but changing, elevations), it may be serious. Because of this, the most seriously affected observations are those of sources at low declination, which track the source for long periods (up to hours).
Magnitude of Position Offset (Astrometric Accuracy)
As noted above, absolute astrometry will be affected by this error. A rough rule-of-thumb estimate of the positional offset for a given observation can be written:
offset ~ 5 * x * y (masec)
where x = sec2(z)*tan(z) for zenith angle z, and y is the separation of the source and calibrator in the elevation direction, in degrees. This expression is appropriate for observations in the A-configuration; for B-configuration divide by 3. As an example, for a source at 20 degrees elevation in the A-configuration with a source-calibrator offset of 2 degrees in elevation, the offset is ~ 240 masec. At 30 degrees elevation the offset is ~ 70 masec. After the fix described below is applied, errors should be much smaller, but we cannot state definitively what they will be because the solution below is only approximate, and because the coefficient k changes from day-to-day (it is weather dependent).
Details of the Correction
To correct for this delay error on a visibility for a given baseline, we must essentially recalculate the atmospheric part of the delay, and remove it (because it was added doubly during this period). To a very rough approximation, the total atmospheric path to a source at elevation e (e differing from antenna to antenna because of the sphericity of the geoid) is:
L / sin(e)
where L is the total additional pathlength of the atmosphere, about 2m. To find the difference in e at the locations of the two antennas, consider a small circle of zenith distance at the array center. In az-el coordinates at the antenna location, to the lowest approximation, this circle will still map into a circle, but displaced from local zenith by d/R (with d the distance of the antenna from the array center, and R the radius of the Earth), with the direction of the displacement in the direction of the antenna viewed from the array center. The equation for a displaced circle, again to the lowest approximation, is:
e = e_0 + d/R * cos(a_0 - a_a)
where e_0 is the elevation at the center of the array, a_0 is the azimuth of the source, and a_a is the azimuth of the antenna location, seen from the center of the array. So the correction is:
L/sin(e_0) + cos(e_0)/sin(e_0)/sin(e_0)*cos(a_0 - a_a) * L*d/R
and the difference from an antenna at the center of the array is just the second term:
L*d/R * cos(e_0)/sin(e_0)/sin(e_0)*cos(a_0 - a_a)
Note that the length L varies from day to day, depending on the amount of water vapor in the atmosphere at the time of observation.
Note that a similar derivation, with more details, can be found here in the "Differential Excess Atmospheric Delay Between Two Antennas" section.
This effect can therefore be corrected by adjusting the phase of the visibility on a per-channel basis, by calculating for each antenna i on that baseline the quantity:
p_i = k * f * d * cot(e_0)*csc(e_0) * cos(a_0 - a_a)
for frequency f, and other terms as above. The parameter k subsumes known physical parameters, weather information during the observation, and some details of the implementation in the software, but is of order 1.0e-6. After calculating that value for the two antennas on the baseline, the phase correction is the difference between them.
Implementation in Post-processing Software
The above correction has been implemented in both AIPS and CASA. In AIPS, it is implemented as part of VLANT, while in CASA it is implemented as part of gencal (with option caltype='antpos'). In both packages, it is triggered automatically when those tasks are run, and the date is in the appropriate range. For CASA, this version of gencal is available in the 4.7.1 release, including the pipeline for that release, so if the VLA calibration pipeline is run from that release (or later), this fix will automatically be applied.
Re-processing of Affected Data
As of February 15, 2017, we are just about to start re-processing all SBs observed during the affected timeframe. That is, we will re-run the VLA Calibration Pipeline on all of those data. If you have affected SBs there is no need to request that your data be run through the pipeline again - it will happen automatically. You will be notified when the re-processing of each of your SBs has completed, and there will be a short period (a few days) during which the full calibrated MS will be available. Calibration tables will be stored and can be reapplied to the raw data in the future.
Re-observation of Affected SBs
If after the aforementioned re-processing of your data, it is clear that there is still a signature of this error in your final data product(s) (be they images or spectra), we will consider re-observing the affected SBs in the next A-configuration (we do not anticipate needing to do this for any SBs observed in the B-configuration). That configuration will start around the beginning of March in 2018. Because we will need to know how many such SBs there are and their distribution vs. LST for the upcoming August 1, 2017 proposal deadline, a request for re-observation will need to be made by June 1, 2017.
A Note on Self-Calibration
If your source is strong enough to self-calibrate, and you do not care about absolute astrometry, then this error should not be an issue for you. You will need to be able to self-calibrate on a short enough timescale that the change in the error is small; namely of order minutes or less. If the error term is large enough (many fringe widths), then it may be necessary to self-calibrate using only short baselines first, then moving to longer ones. Some experimentation with the procedure may be beneficial.
An Example
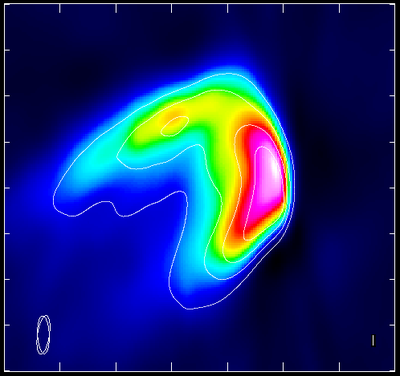
The images below are made from a project that has some data taken while the error was present, and some after it was fixed. Because there are before and after data, this provides an excellent check of how well the fix works. The figure below shows an image with contours taken from the observations after the error was fixed, and false color taken from the observations while the error was in the system, with no post-processing fix. You can see a clear offset between the two and possibly a hint of slightly different structure.
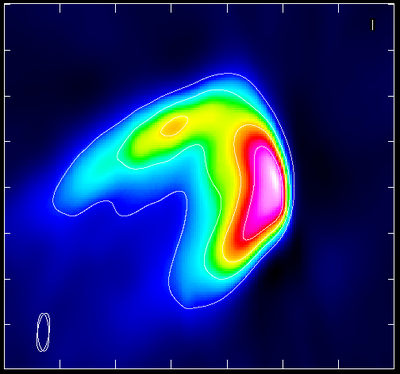
The next figure shows a similar image, but with the post-processing fix applied to the data taken while the error was in place. Agreement is much better, although there is still a small offset.


Connect with NRAO