
Complex Gain Calibration
VLA capabilities September 2011 - January 2013
1. General Guidelines for Gain Calibration
Adequate gain calibration is a complicated function of source-calibrator separation, frequency, array scale, and weather. And, since what defines adequate for some experiments is completely inadequate for others, it is impossible to define any simple guidelines to ensure adequate phase calibration in general. However, some general statements remain valid most of the time. These are given below.
- Tropospheric effects dominate at wavelengths shorter than 20 cm, ionospheric effects dominate at wavelengths longer than 20 cm.
- Atmospheric (troposphere and ionosphere) effects are nearly always unimportant in the C and D configurations at L and S bands, and in the D configuration at X and C bands. Hence, for these cases, calibration need only be done to track instrumental changes - once per hour is generally sufficient.
- If your target object has sufficient flux density to permit phase self-calibration, there is no need to calibrate more than once hourly at low frequencies (L/S/C bands) or 15 minutes at high frequencies (K/Ka/Q bands) in order to track pointing or other effects that might influence the amplitude scale.
- The smaller the source-calibrator angular separation, the better. In deciding between a nearby calibrator with an "S" code in the calibrator database, and a more distant calibrator with a "P" code, the nearby calibrator is usually the better choice (see http://www.vla.nrao.edu/astro/calib/manual/key.html for a description of calibrator codes).
- At high frequencies, and longer configurations, rapid switching between the source and nearby calibrator is often helpful. See Rapid Phase Calibration and the Atmospheric Phase Interferometer (API).
2. Rapid Phase Calibration and the Atmospheric Phase Interferometer (API)
For some objects, and under suitable weather conditions, the phase calibration can be considerably improved by rapidly switching between the source and calibrator. Source-Calibrator observing cycles as short as 40 seconds can be used. However, observing efficiency declines for very short cycle times, so it is important to balance this loss against a realistic estimate of the possible gain. Experience has shown that cycle times of 100 to 150 seconds at high frequencies have been effective for source-calibrator separations of less than 10 degrees. For the VLA this was known as "fast-switching." For the EVLA it is just a loop of source-calibrator scans with short scan length. This technique "stops" tropospheric phase variations at an effective baseline length of ∼vat/2 where va is the atmospheric wind velocity aloft (typically 10 to 15 m/sec), and t is the total switching time. It has been demonstrated to result in images of faint sources with diffraction-limited spatial resolution on the longest EVLA baselines. Under average weather conditions, and using a 120 second cycle time, the residual phase at 43 GHz should be reduced to ≤ 30 degrees. Further details can be found in VLA Scientific Memos # 169 and 173 (http://www.vla.nrao.edu/memos/sci/). These memos, and other useful information, can be obtained from Reference 12 in Documentation.
Note that the fast switching technique will not work in bad weather (such as rain showers, or when there are well-developed convection cells - most notably, thunderstorms).
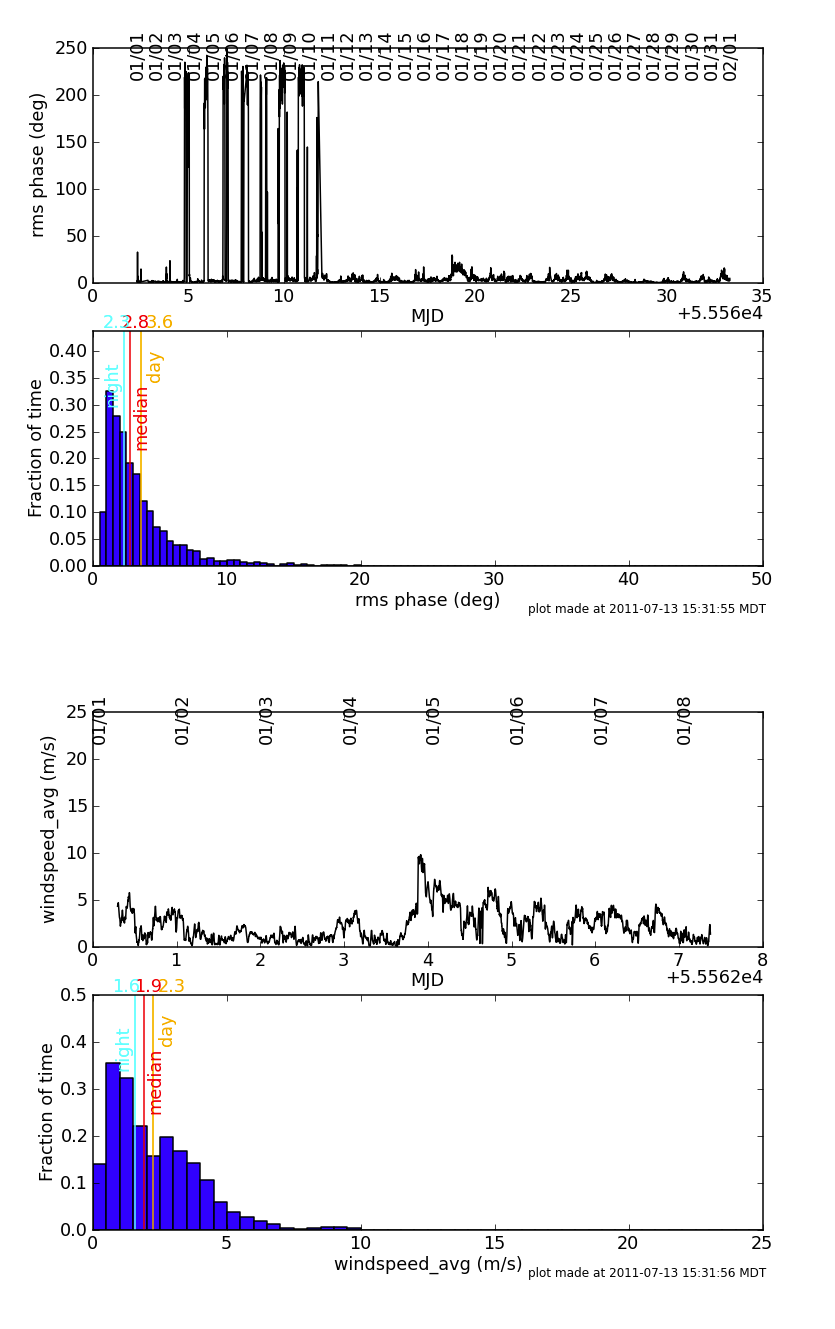
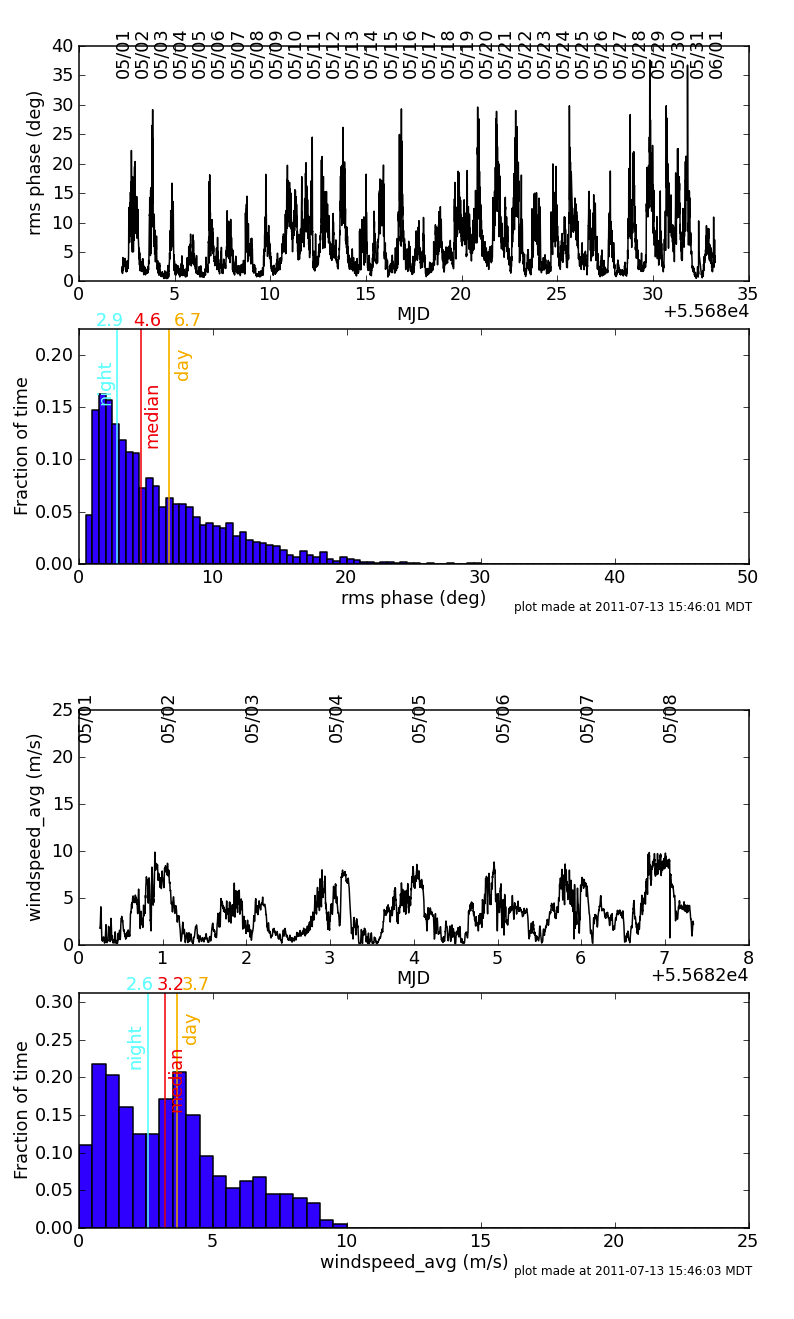
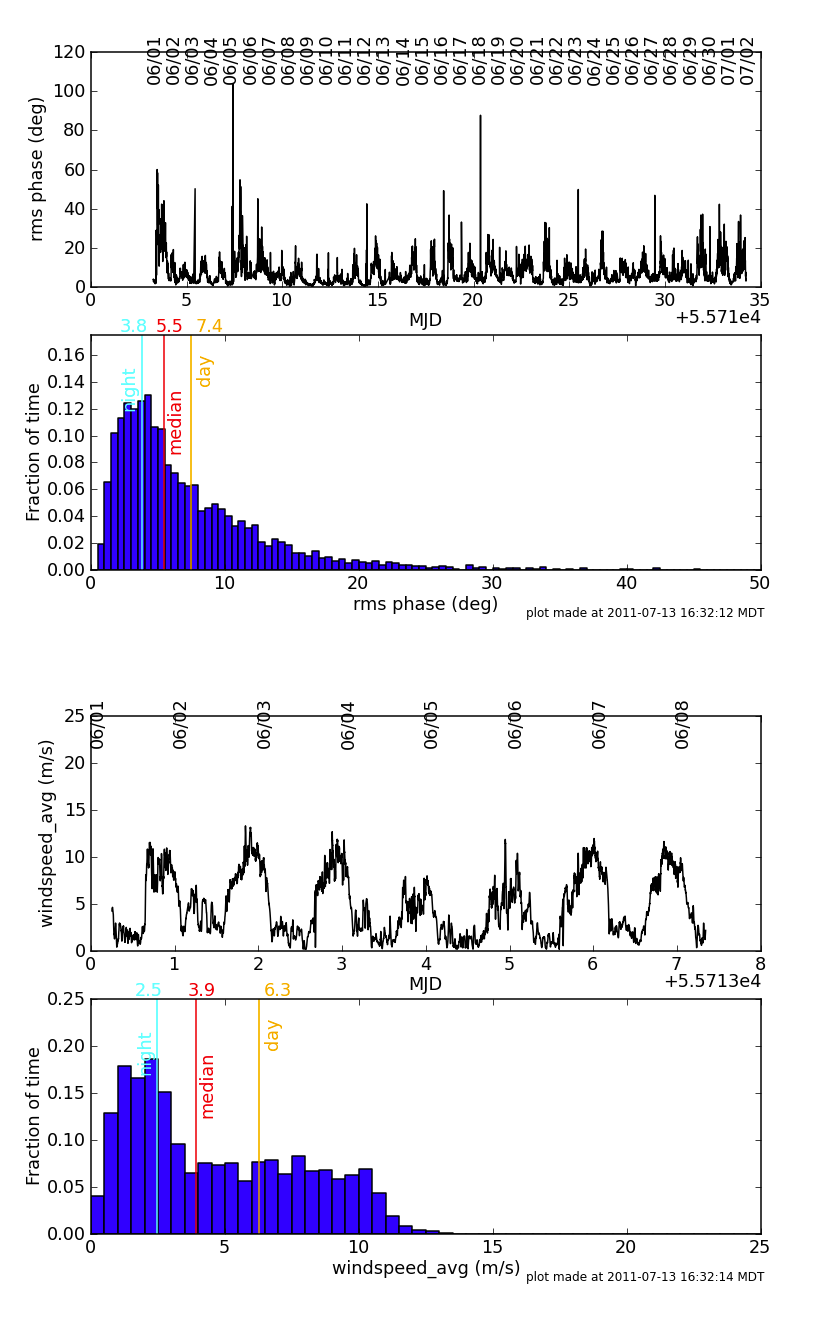
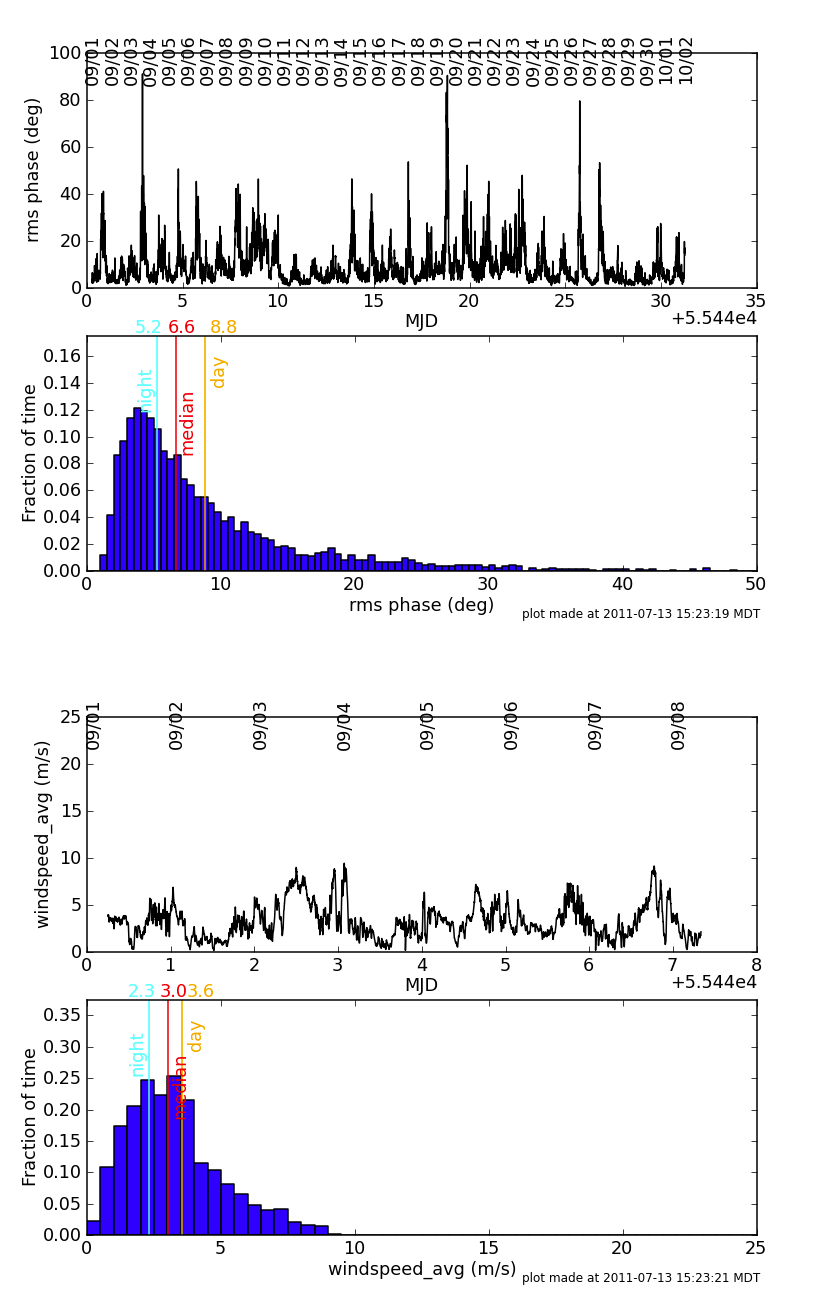
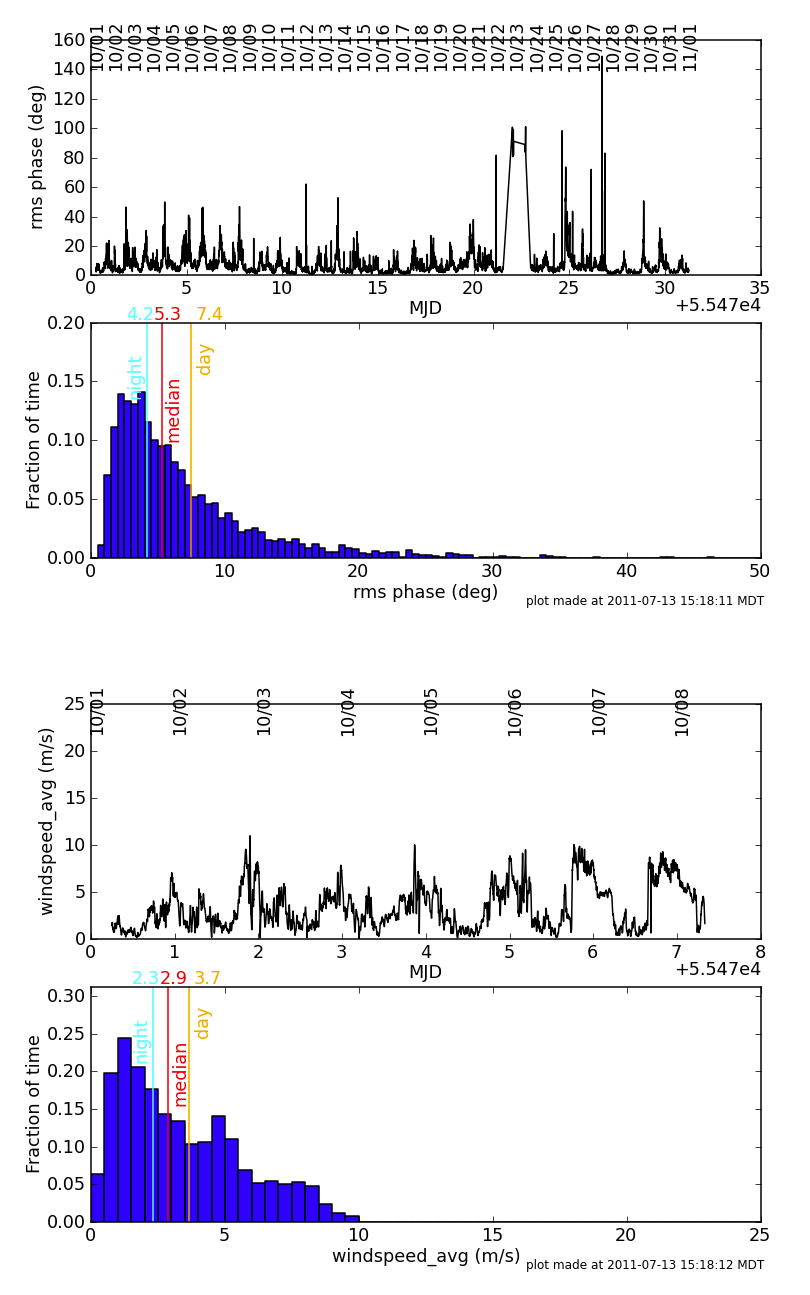
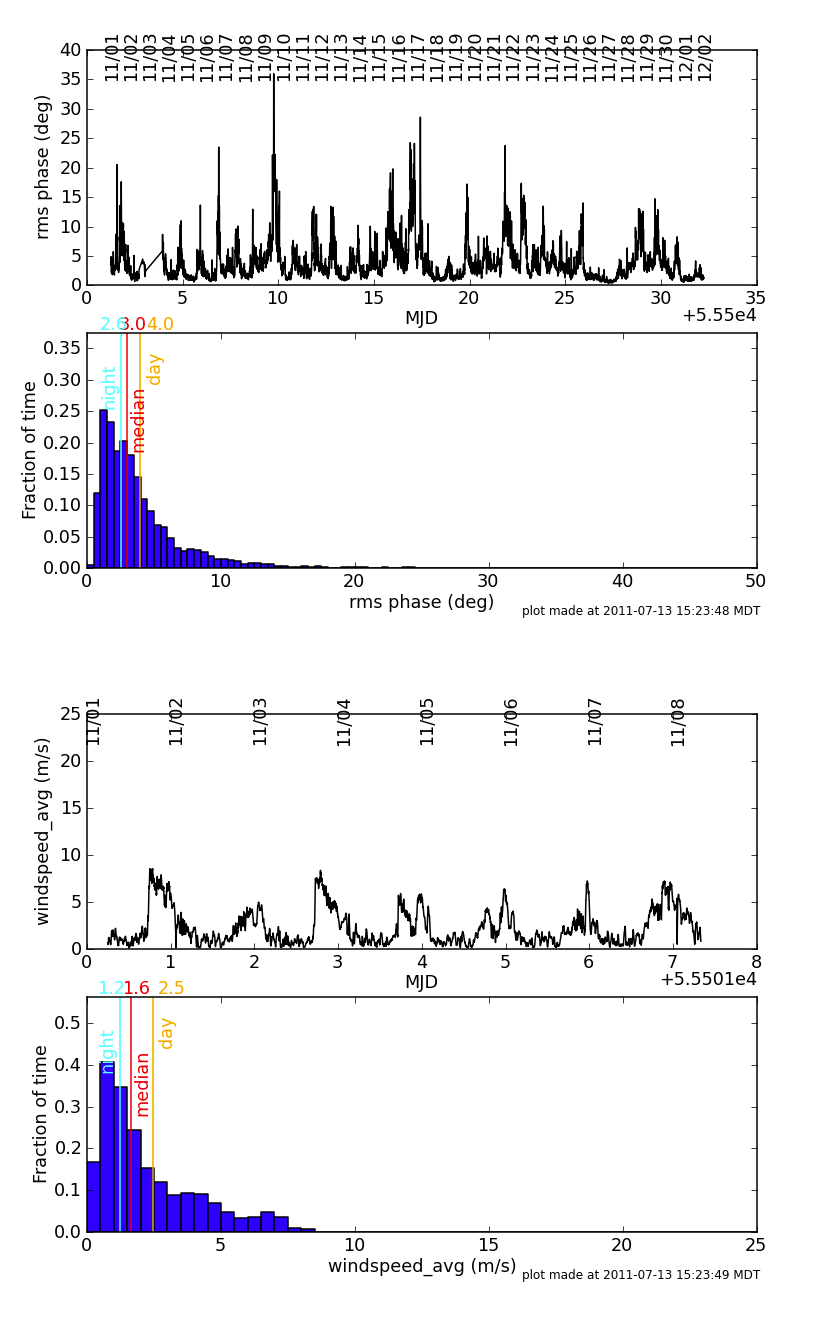
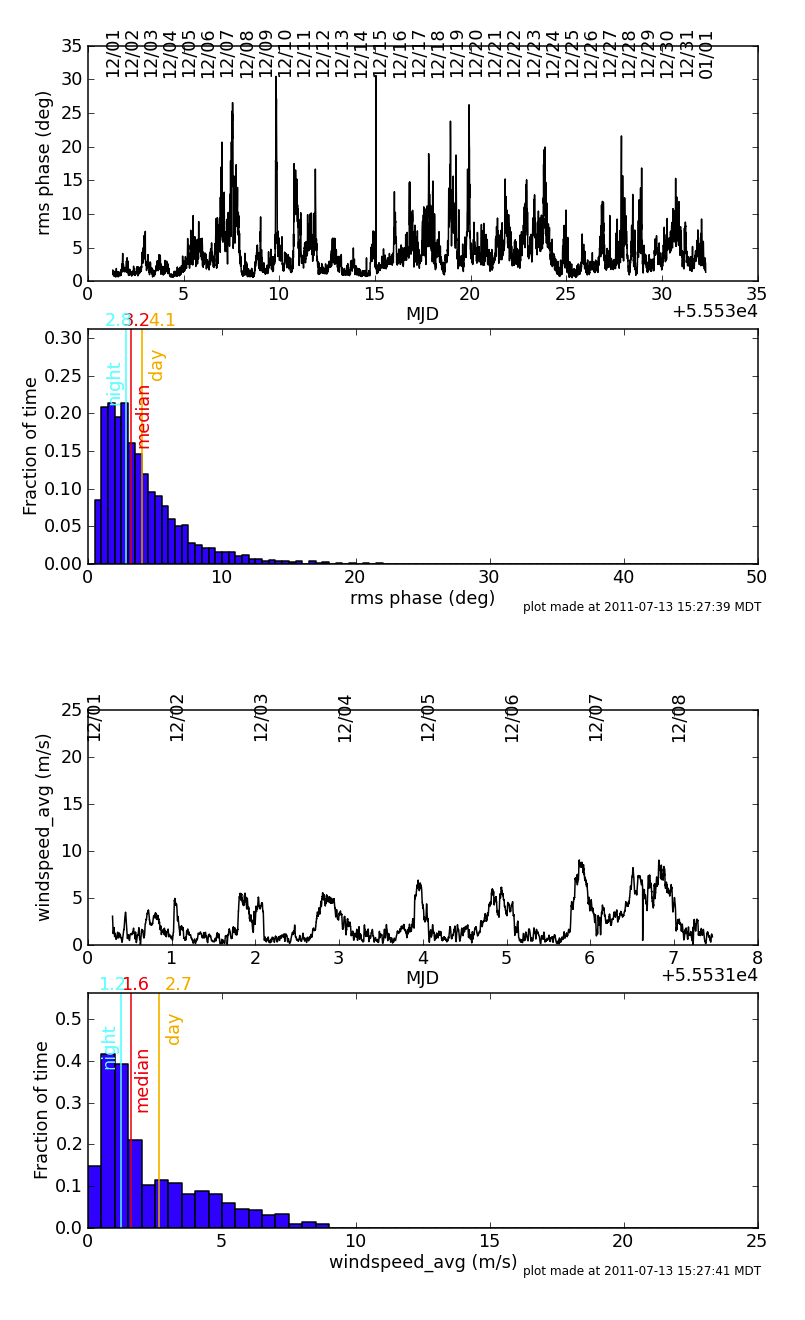
An Atmospheric Phase Interferometer (API) is used to continuously measure the tropospheric contribution to the interferometric phase using an interferometer comprising two 1.5 meter antennas separated by 300 meters, observing an 11.7 GHz beacon from a geostationary satellite. The API data can be used to estimate the required calibration cycle times when using fast switching phase calibration, and in the worst case, to indicate to the observer that high frequency observing may not be possible with current weather conditions. A detailed description of the API may be found at http://www.vla.nrao.edu/astro/guides/api/.
Plots of current/historical data can be found at: https://webtest.aoc.nrao.edu/cgi-bin/thunter/api.cgi
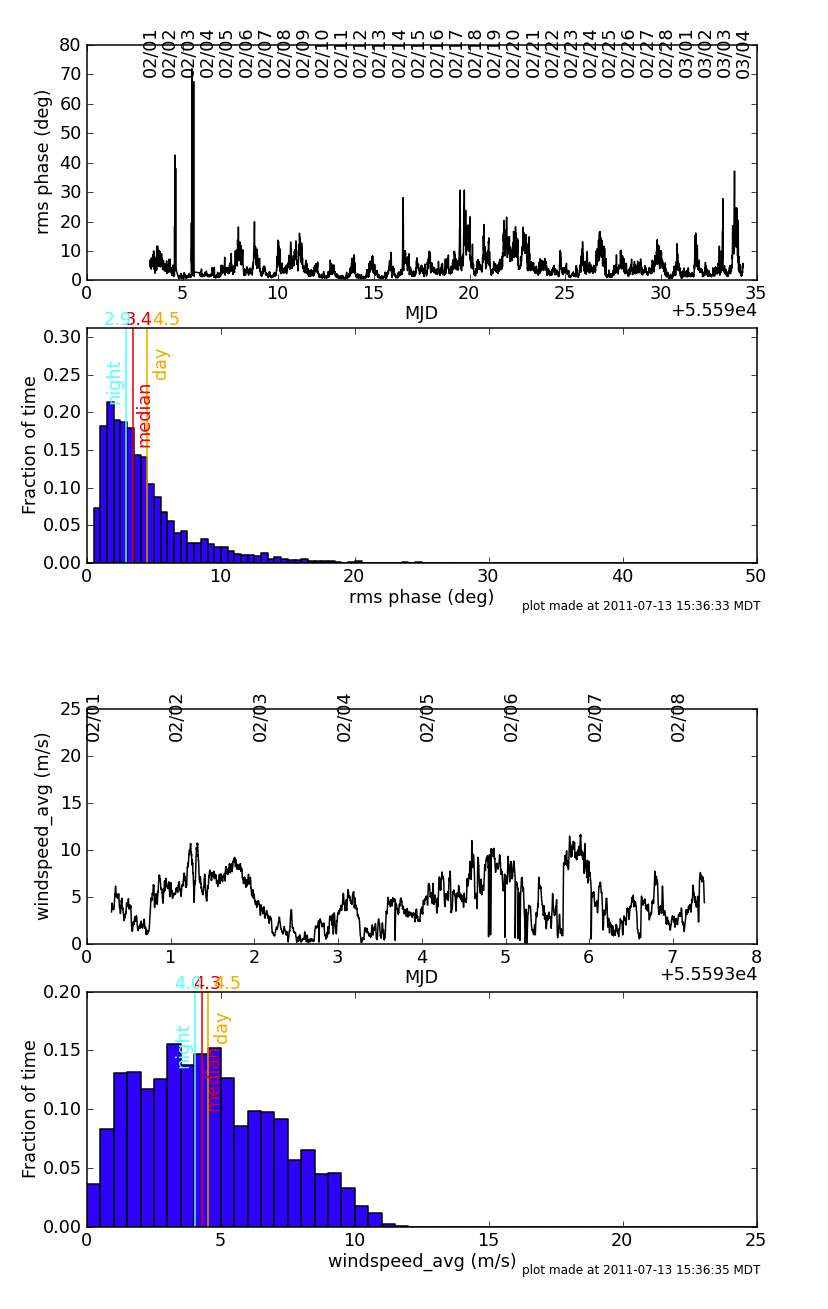
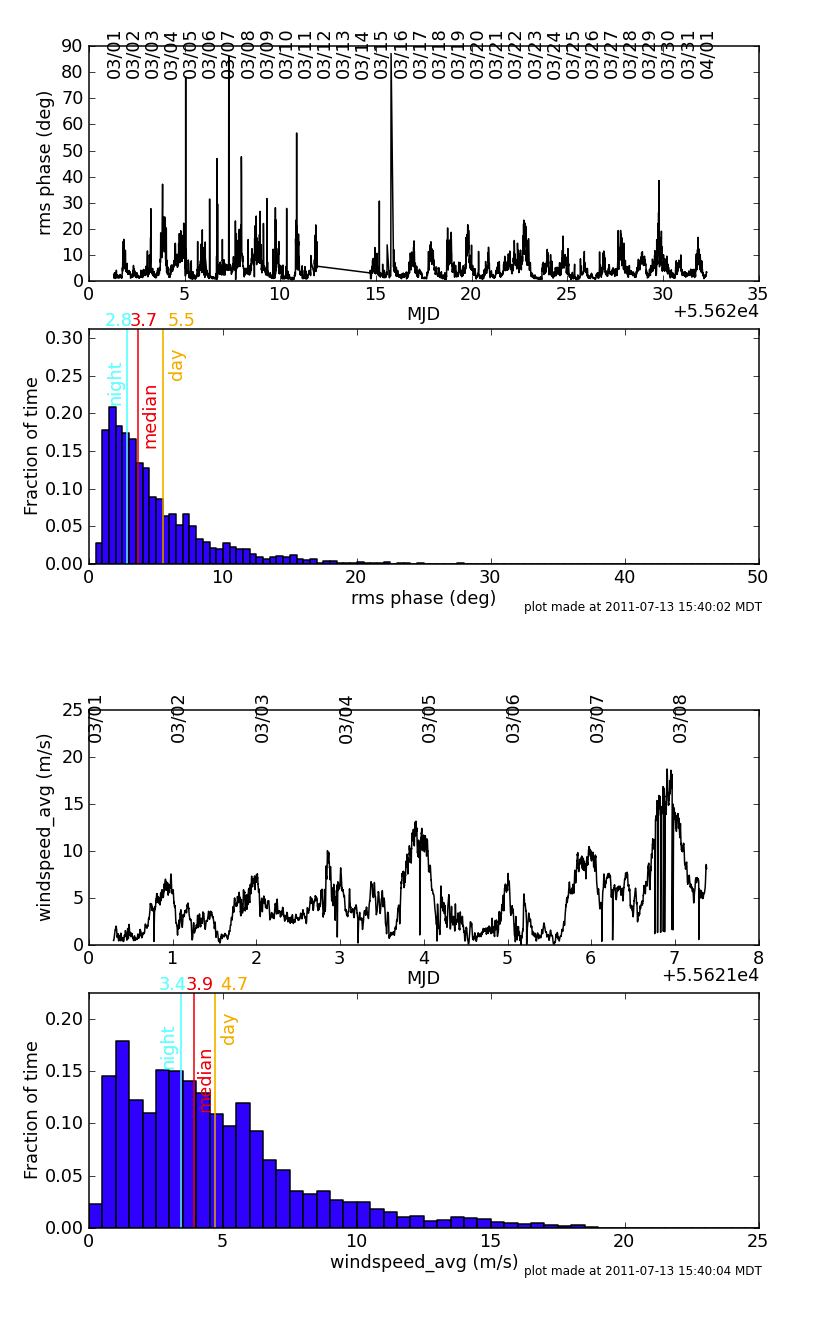
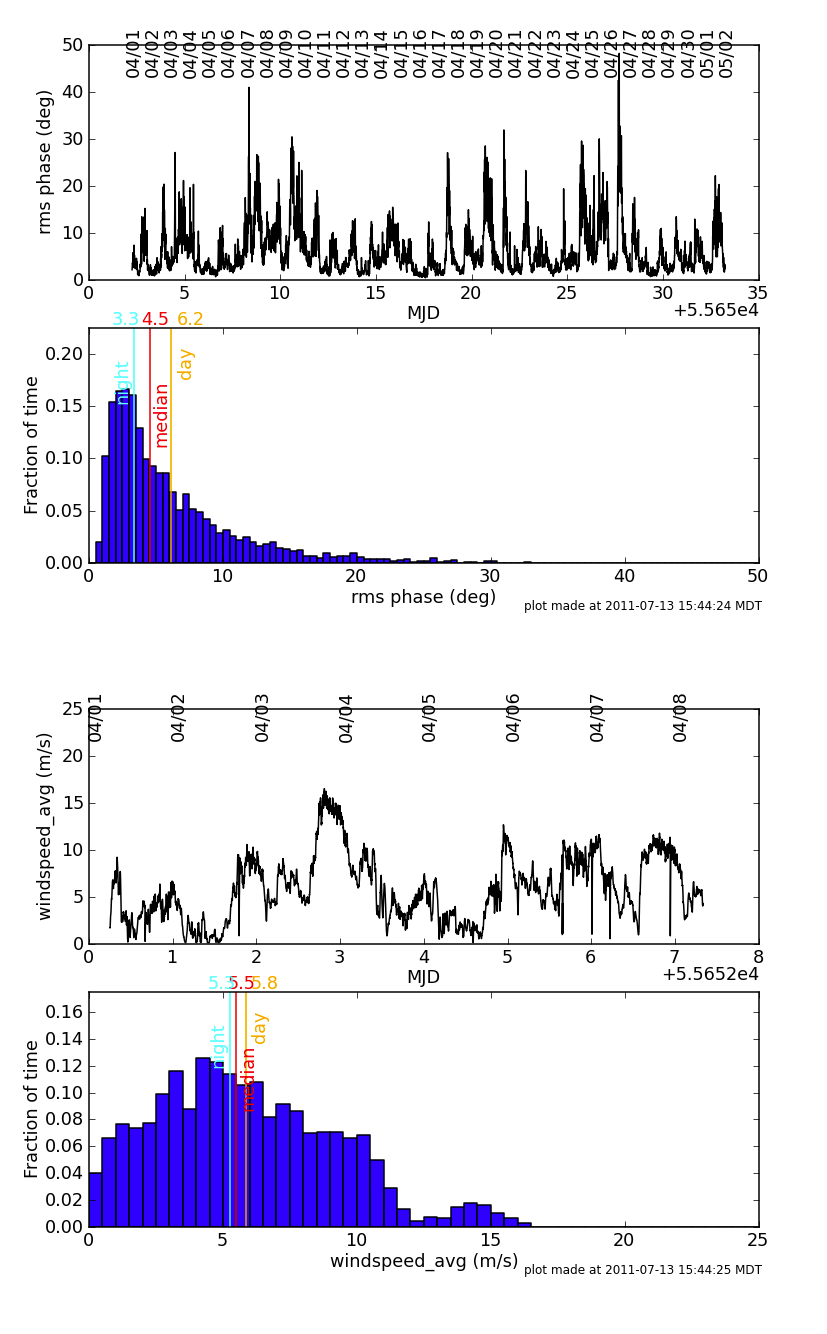
Characteristic seasonal averages are represented below:
| Month | API (night) [deg] | API (median) [deg] | API (day) [deg] | Wind (night) [m/s] | Wind (median) [m/s] | Wind (day) [m/s] |
|---|---|---|---|---|---|---|
| January | 2.3 | 2.8 | 3.6 | 1.6 | 1.9 | 2.3 |
| February | 2.9 | 3.4 | 4.5 | 4.0 | 4.3 | 4.5 |
| March | 2.8 | 3.7 | 5.5 | 3.4 | 3.9 | 4.7 |
| April | 3.3 | 4.5 | 6.2 | 5.3 | 5.5 | 5.8 |
| May | 2.9 | 4.6 | 6.7 | 2.6 | 3.2 | 3.7 |
| June | 3.8 | 5.5 | 7.4 | 2.5 | 3.9 | 6.3 |
| July | 6.2 | 8.3 | 10.5 | 2.9 | 2.9 | 3.0 |
| August | 5.4 | 7.1 | 11.3 | 1.7 | 2.3 | 3.0 |
| September | 5.2 | 6.6 | 8.8 | 2.3 | 3.0 | 3.6 |
| October | 4.2 | 5.3 | 7.4 | 2.3 | 2.9 | 3.7 |
| November | 2.6 | 3.0 | 4.0 | 1.2 | 2.5 | 1.6 |
| December | 2.8 | 3.2 | 4.1 | 1.2 | 1.6 | 2.7 |
Click on the Month links above to see plots of phase and wind speed versus time.
- Note: day indicates sunrise to sunset values; night indicates sunset to sunrise values.

