Resolution
Resolution
The VLA's resolution is generally diffraction-limited, and thus is set by the array configuration and frequency of observation. It is important to be aware that a synthesis array is blind to structures on angular scales both smaller and larger than the range of fringe spacings given by the antenna distribution. For the former limitation, the VLA acts like any single antenna—structures smaller than the diffraction limit (θ ∼ λ/Bmax) are not seen—with the resulting image smoothed to the resolution of the array. The latter limitation is unique to interferometers; it means that structures on angular scales significantly larger than the fringe spacing formed by the shortest baseline are not measured. No subsequent processing can fully recover this missing information, which can only be obtained by observing in a more compact array configuration, by using the mosaicking method, or by utilizing data from an instrument such as a large single antenna or a compact array comprising smaller antennas which provides this information.
Table 3.1.1 summarizes the relevant resolution information. This table shows the maximum and minimum antenna separations, the approximate synthesized beam size (full width at half-power) for the central frequency for each band, and the scale at which severe attenuation of large scale structure occurs.
| Configuration | A | B | C | D |
|---|---|---|---|---|
| Bmax (km1) | 36.4 | 11.1 | 3.4 | 1.03 |
| Bmin (km1) | 0.68 | 0.21 | 0.0355 | 0.035 |
| Band | Synthesized Beamwidth θHPBW(arcsec)1,2,3 | |||
| 74 MHz (4) | 24 | 80 | 260 | 850 |
| 350 MHz (P) | 5.6 | 18.5 | 60 | 200 |
| 1.5 GHz (L) | 1.3 | 4.3 | 14 | 46 |
| 3.0 GHz (S) | 0.65 | 2.1 | 7.0 | 23 |
| 6.0 GHz (C) | 0.33 | 1.0 | 3.5 | 12 |
| 10 GHz (X) | 0.20 | 0.60 | 2.1 | 7.2 |
| 15 GHz (Ku) | 0.13 | 0.42 | 1.4 | 4.6 |
| 22 GHz (K) | 0.089 | 0.28 | 0.95 | 3.1 |
| 33 GHz (Ka) | 0.059 | 0.19 | 0.63 | 2.1 |
| 45 GHz (Q) | 0.043 | 0.14 | 0.47 | 1.5 |
| Band | Largest Angular Scale θLAS(arcsec)1,4 | |||
| 74 MHz (4) | 800 | 2200 | 20000 | 20000 |
| 350 MHz (P) | 155 | 515 | 4150 | 4150 |
| 1.5 GHz (L) | 36 | 120 | 970 | 970 |
| 3.0 GHz (S) | 18 | 58 | 490 | 490 |
| 6.0 GHz (C) | 8.9 | 29 | 240 | 240 |
| 10 GHz (X) | 5.3 | 17 | 145 | 145 |
| 15 GHz (Ku) | 3.6 | 12 | 97 | 97 |
| 22 GHz (K) | 2.4 | 7.9 | 66 | 66 |
| 33 GHz (Ka) | 1.6 | 5.3 | 44 | 44 |
| 45 GHz (Q) | 1.2 | 3.9 | 32 | 32 |
- These estimates of the synthesized beamwidth are for a uniformly weighted, untapered map produced from a full 12 hour synthesis observation of a source which passes near the zenith.
- Notes:
- 1. Bmax is the maximum antenna separation, Bmin is the minimum antenna separation, θHPBW is the synthesized beam width (FWHM), and θLAS is the largest scale structure visible to the array.
- 2. The listed resolutions are appropriate for sources with declinations between −15 and 75 degrees.
- 3. The approximate resolution for a naturally weighted map is about 1.5 times the numbers listed for θHPBW. The values for snapshots are about 1.3 times the listed values.
- 4. The largest angular scale structure is that which can be imaged reasonably well in full synthesis observations. For single snapshot observations, the quoted numbers should be divided by two.
- 5. For the C configuration, an antenna from the middle of the north arm is moved to the central pad N1. This results in improved imaging for extended objects, but may slightly degrade snapshot performance. Note that although the minimum spacing is the same as in D configuration, the surface brightness sensitivity and image fidelity to extended structure is considerably inferior to that of the D configuration.
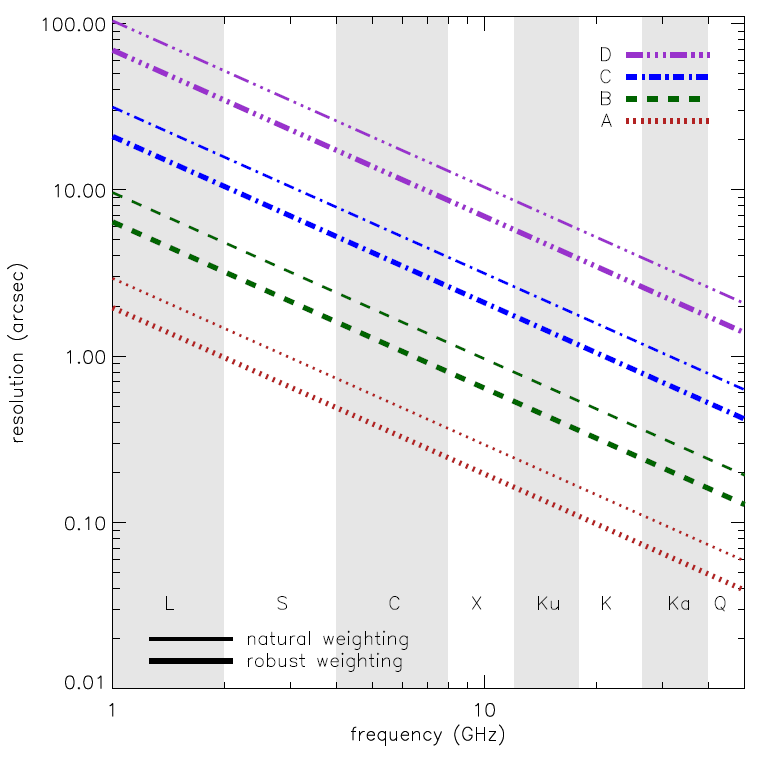
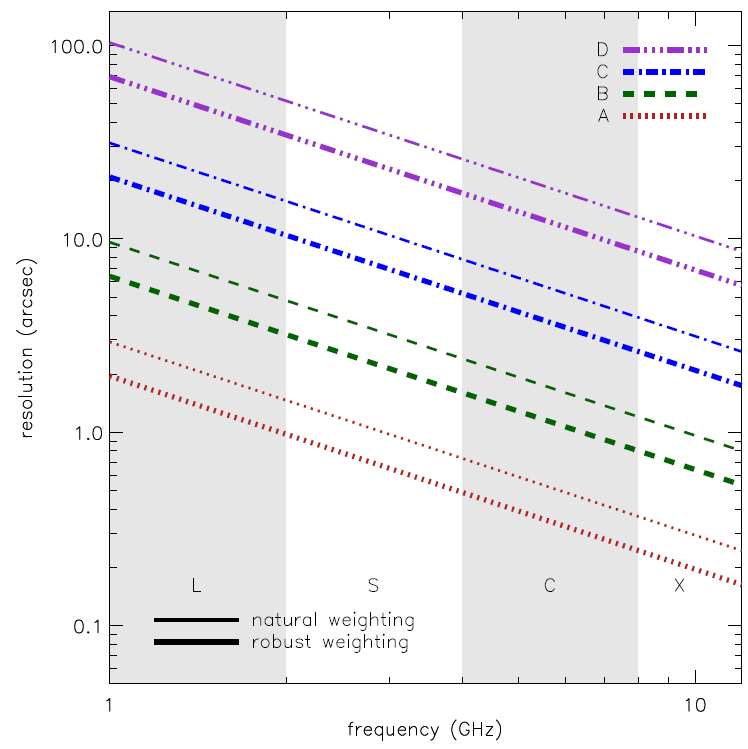
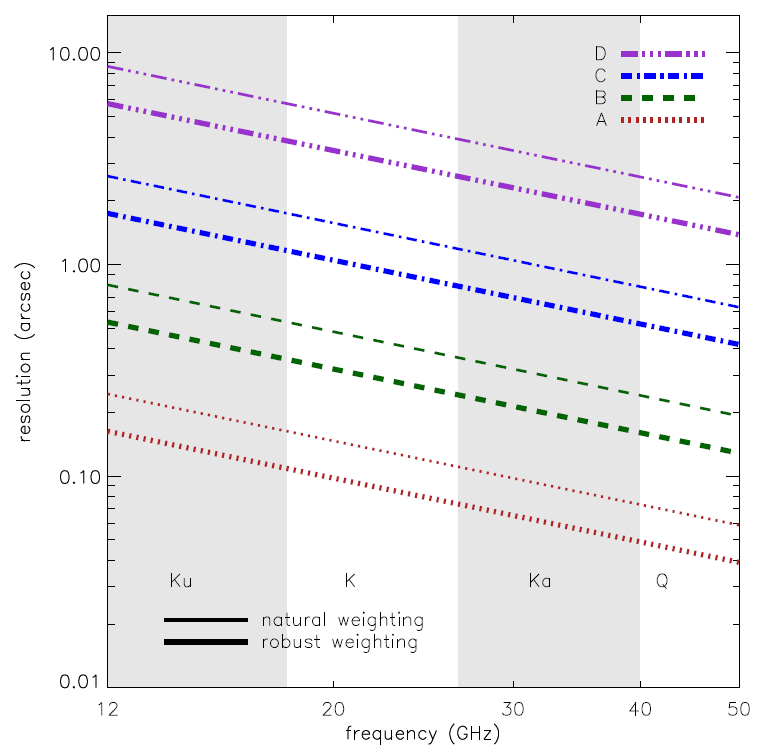
The following figure is a graphical representation of the synthesized beamwidths for natural and robust weighting for the four main array configurations between 1 and 50 GHz. Also available are synthesized beamwidth figures for the low frequency (1–12 GHz) and the high frequency (12–50 GHz) receiver bands.
(click image to enlarge) A project with the goal of doubling the longest baseline available in the A configuration, by establishing a real-time fiber optic link between the VLA and the VLBA antenna at Pie Town, was established in the late 1990s and used through 2005. This link is no longer operational; the objective of implementing a new digital Pie Town link, now that EVLA construction is complete, remains unfunded.


Connect with NRAO