Radio Frequency Interference
Introduction
The very wide bandwidths of the VLA mean that radio frequency interference (RFI) will be present in a far larger fraction of VLA observations than in observations made with the old systems. Considerable effort has gone into making the VLA's new electronics as linear as possible so that the effects of any RFI will remain limited to the actual frequencies at which the RFI exists. Non-linear effects, such as receiver saturation, should occur only for those very unlikely, and usually very brief, times when the emitter is within the antenna primary beam.
RFI is primarily a problem within the low frequency (C, S, L, and the low-band system) bands, and is most serious to the D-configuration. With increasing frequency and increasing resolution comes an increasing fringe rate, which is often very effective in reducing interference to tolerable levels.
The bands within the tuning range of the VLA which are specifically protected for radio astronomy are: 73.0-74.6 MHz, 322.0-328.6 MHz, 1400–1427 MHz, 1660.6–1670.0 MHz, 2690–2700 MHz, 4990–5000 MHz, 10.68–10.7 GHz, 15.35–15.4 GHz, 22.21–22.5 GHz, 23.6–24.0 GHz, 31.3–31.8 GHz, and 42.5–43.5 GHz. No external interference should occur within these bands.
RFI seen in VLA data can be internal or external. Great effort has been expended to eliminate all internally-generated RFI. Nevertheless, some internal RFI remains, which we are working hard to eliminate. Nearly all such internally-generated signals are at multiples of 128 MHz. So far as we know, all such internal signals are unresolved in frequency, and therefore will affect only a single channel.
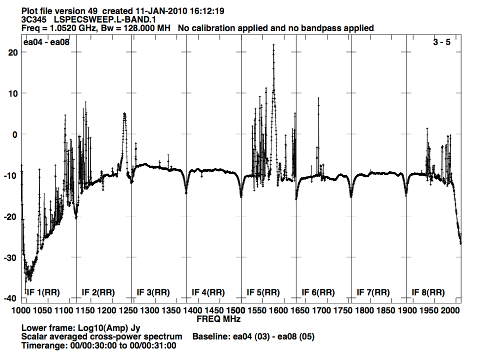
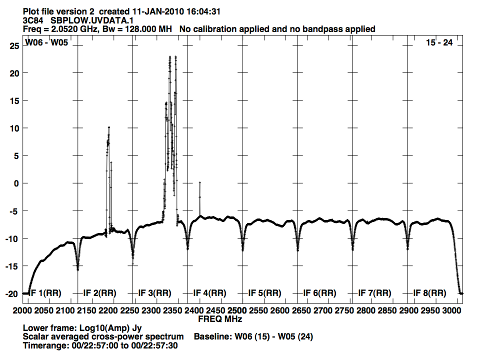
RFI of external origin will be an increasing problem to astronomical observations. Figure 5.1 shows a raw power cross-power spectrum at L-band while figure 5.2 shows a similar plot for the lower half of S-band. Table 5.1 lists some of the sources of external RFI at the VLA site that might be observed within the VLA's expanded tuning range within L and S bands.
|
|
| Figure 5.1: Spectrum of L-band RFI in 2010. This shows the major interfering signals seen across the full 1 GHz bandwidth available to the L-band receivers. Each of the eight spectral windows displays 128 MHz from a separate subband. These are raw data, uncalibrated for the bandpass of either the digital filter or the receiver. The high linearity of the EVLA's electronics and correlator will permit astronomical observing within any frequencies not containing external interference. Note that the y-axis is in logarithmic units (dB). |
|
|
| Figure 5.2: Spectrum of S-band RFI in 2010. This shows the raw spectrum of the lower half of S-Band from 2.0 to 3.0 GHz. The major interference at 2.35 GHz is from satellite radio. The y-axis is in logarithmic units (dB). |
| Frequency (MHz) | Source | Comment | Frequency (MHz) | Source | Comment | |
|---|---|---|---|---|---|---|
| 1025–1150 | Aircraft navigation | Very strong | 1564–1584 | GPS L1 | Very strong | |
| 1200 | VLA modem | 1598–1609 | GLONASS L1 | |||
| 1217–1237 | GPS L2 | Very strong | 1618–1627 | IRIDIUM satellites | ||
| 1243–1251 | GLONASS L2 | 1642 | 2nd harmonic VLA radios | Sporadic | ||
| 1254 | Aeronautical radar | 1683–1687 | GOES weather satellite | |||
| 1268 | Aeronautical radar | 1689–1693 | GOES weather satellite | |||
| 1268 | COMPASS E6 | 1700–1702 | NOAA weather satellite | |||
| 1310 | Aeronautical radar | 1705–1709 | NOAA weather satellite | |||
| 1317 | Aeronautical radar | 1930–1990 | PCS cell phone base stations | |||
| 1330 | Aeronautical radar | 2178–2195 | Satellite Downlink | Very strong* | ||
| 1337 | Aeronautical radar | 2320–2350 | Sirius/XM Satellite radio | Very strong* | ||
| 1376–1386 | GPS L3 | Intermittent | 3700–4200 | Satellite Downlinks | Very strong* | |
| 1525–1564 | INMARSAT satellites | |||||
| These entries are not the only examples of RFI at the VLA. There are links below for band-specific RFI that are more exhaustive. It is worth noting that new sources of RFI are emerging / being discovered by NRAO staff and will be reported in the band-specific RFI sections below. |
||||||
Observing and Post Processing Considerations
Gain compression occurs when the input power of an amplifier is increased to a level that reduces the gain of the amplifier and causes a nonlinear increase in output power. The VLA electronics, including the WIDAR correlator, have been designed to minimize gain compression due to very strong RFI signals, so that in general it is possible to observe in spectral windows containing RFI, provided the spectra are well sampled to constrain Gibbs ringing and spectral smoothing (such as Hanning) is applied. Both AIPS and CASA provide useful tasks which automatically detect and flag spectral channels/times which contain strong RFI.
Extracting astronomy data from frequency channels in which the RFI is present is much more difficult. Testing of algorithms which can distinguish and subtract RFI signals from interferometer data is ongoing.
The 3-bit samplers will be more susceptible to RFI signals than the 8-bit samplers, since the latter have more levels within which these strong signals can be accommodated. However, since the RFI power at the bands where the 3-bit samplers will most commonly be used (C, X, Ku, K, Ka, and Q) is nearly always less than the total noise power, we do not expect problems when wide-band 3-bit observing is done in these bands.
Calibration of VLA data when strong RFI is present within a subband can be difficult. Careful editing of the data, using newly available programs within CASA and AIPS, will be necessary before sensible calibration can be done. The use of spectral smoothing, typically Hanning, prior to editing and calibration is strongly recommended when RFI is present within a subband.
Identification and removal of RFI is always more effective when the spectral and temporal resolutions are high. However, the cost of higher spectral and temporal resolution is in database size and, especially, in computing time. A good strategy is to observe with high resolution then average down in time and frequency once the editing is completed.
Note: C-band is also impacted by strong RFI caused by microwave links near 6 GHz in the A and B configurations. As a result, 3-bit data obtained with the standard setup are corrupted. We advise observers to use a setup with mixed 3-bit and 8-bit samplers. Refer to the C-band Observations in the Presence of Strong RFI Microwave Links section for more details.
Real-time RFI Blanking
Real-time RFI blanking has been implemented in the default NRAO resources for L, S, C, X, and Ku-bands, and can be activated by the observer in custom resources (for spectral line or otherwise) in the Resource Catalog Tool (RCT). The web page The Impact of real-time RFI Blanking on HI 21 cm Observations
shows the improvements in the redshifted HI 21 cm and OH 18 cm (951-1431 MHz) observations when the blanking is invoked. For more details on using the real-time RFI blanking in your custom VLA resource, see the RFI blanking page in the RCT manual.
RFI Listing per VLA Frequency Band
| Low Frequency | High Frequency |
|---|---|
|
|
RFI Spectral sweeps with the VLA
- Most recent sweep: September 2025, B-configuration
Satellite Transmissions and the Clarke Belt
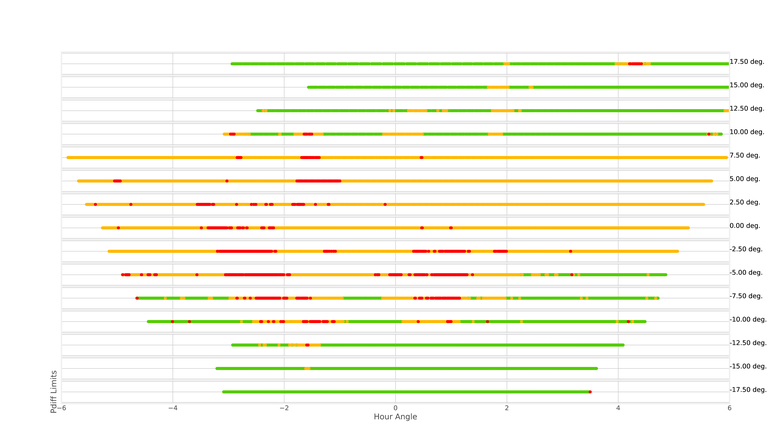
The three entries with asterisks in the table deserve extra discussion. These are all satellite transmissions, whose severity is a strong function of the angular offset between the particular satellite and the antenna. It appears that significant degradation can occur if the antennas are within ~10° of the satellite. The great majority of the satellites are along the Clarke Belt—the zone of geosynchronous satellites. As seen from the VLA, this belt is at a declination of about −5.5°. There are dozens—probably hundreds—of satellites parked along this belt, transmitting in many bands: at a minimum, S, C, Ku, K, and Ka-bands. Observations of sources in the declination range of +5° to −15° can expect to be significantly degraded due to satellite transmission. A survey of satellite interference at the VLA was conducted between 2016 and 2017 for S-band. Figure 5.1.3 provides a snapshot overview of the observed interference in this survey. The figure shows the severity of observed compression in the VLA receive system as a function of hour angle and declination. This can be used to inform scheduling decisions for observing at S band in order to avoid interference from satellites. It is highly recommended to avoid regions that are indicated in red in Fig. 5.1.3. A more detailed analysis of this survey will be made available through the EVLA memo series in the near future and will also be linked through this document. Surveys of the satellite belt at other bands are envisioned in the future.
C-band (4–8 GHz), X-band (8–12 GHz), and Ku band (12–18 GHz) are subject to strong RFI from satellites in the Clarke Belt. Such strong RFI may result in saturating the 3-bit samplers. Therefore, 3-bit observations at C- and X-bands should be setup following the example in the 8/3-bit Attenuator Settings page.
The Sirius digital radio system, and probably the satellites in the 2178–2195 MHz band, comprises three satellites in a 24-hour, high eccentricity orbit with the apogee above the central U.S. For the Sirius system, the orbit is arranged such that each of the three satellites spends about eight hours near an azimuth of 25° and an elevation of 65°. The corresponding region in astronomical coordinates is between declinations 50° to 65°, and hour angles between −1 and −2 hours. Observations at S-band within that area may—or may not—be seriously affected. The most reliable way to judge the seriousness of the satellite emissions is to inspect the switched power table data, particularly in those subbands where there is little RFI.
Although most of the stronger sources of RFI are always present, it is very difficult to reliably predict their effect on observations. Besides the already noted dependence on frequency and array configuration, there is another significant dependency on sky location for those satellites in geostationary orbit. For these transmitters (e.g., the frequency range from 3.8–4.2 GHz), the effect on observing varies dramatically on the declination of the target source. Sources near zero declination will be very strongly affected, while observations north of the zenith may well be nearly unaffected, especially at the highest resolutions.
|
|
|---|
| Figure 5.3: Minimum compression values averaged across interference free spectral windows and both circular polarizations at the VLA for 2-4 GHz as of 2016/2017. The horizontal axis shows Hour Angles, while the vertical ranges from -17.5 to +17.5 degrees declination in 2.5 deg. steps. The color coding correspond to green <5% compression expected, orange for 5 - 20% compression expected, and red for compression >20% expected when observing in those parts of the sky at any given time. |
Other helpful information and/or plots related to RFI
- VLA Electromagnetic Spectrum Monitor 1 (ESM1) omni-directional monitoring since 10/2025
- VLA Stand Alone Monitoring Systems (total power plots) - 2005-2023
- The Interference Protection Group (IPG)
- RFI Survey, January 2003, 2GHz-18GHz (PDF)
- NTIA's US Frequency Allocation Chart
- Satellite Constellation Survey (July 1998)
For additional information about RFI, contact the NRAO helpdesk


Connect with NRAO