Check SB Setup and Duration
New feature with OPT version 1.37 |
| Polar coordinate AZ / EL plot. There is now a section that displays the sources of the SB in a polar coordinate plot as a function of azimuth and elevation for the LST range and duration of the SB. See below for an example image. |
While creating an SB, it is important to keep in mind the allocated time in the PB you are working in. While we do allow observers to submit over the allocated time per PB, i.e., multiple SBs for multiple sources or multiple SBs to cover a wide range of LST start ranges to help improve chances of observing. The sum of the SBs or a single SB must not exceed the allocated time of a PB. For example, if a PB is allocated 4 hours, the observer may submit a 4 hour SB, a 2 hour SB with a count of 2, 2x 2 hour SBs, many SBs of varying lengths, many linked SBs (i.e., only observe one of the 2 or 3 SBs, etc.), or any combination of those options. Just be sure the sum of SBs you wish to be observed do not exceed the allocated time. For details on how to link SBs, refer to the Linking SBs section of this manual.
Static Report Tab
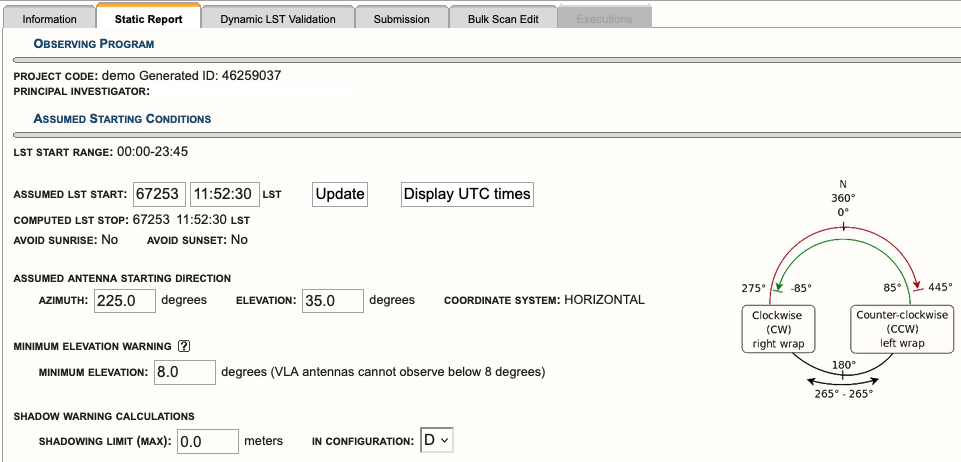
The Static Report tab (Figure 4.4.1) should be accessed regularly to double check the layout of the SB. This tab provides a table view of all (re)sources imported into the scans, including an instrument configuration summary, time on source summary, and a summary report of the SB. At the bottom of this tab, in the interface feedback strip, warnings and errors will appear if there are issues with the SB, i.e., antenna shadowing (if in D or C-configuration), EL limit warnings (if the EL is > 80d or < 8d (unless otherwise manually set)), if the LST start range overlaps with sunrise or sunset (if they have been selected), etc.. Below Figure 4.4.1 is a table explaining the top portion of the Static Report tab.
|
|
|---|
|
Figure 4.4.1: Example of the top portion of the Static Report tab. |
|
Static Report Tab (top portion) |
|
|---|---|
| Observing Program |
Project Code: Project (i.e., proposal) code will be displayed. If you are working on a test project you created, the project code will be your global ID with an '_n' appended (such as in Figure 4.4.1). Generated ID: Often referred to as the SB ID. Principle Investigator: PI name and email. Use your browser's Print feature to print this report, is simply a suggestion that you may use your browser's print feature to print the SB to a PDF. Before doing so, be sure to expand all loops within the SB's Schedule Summary table to capture all of the scans. |
| Assumed Starting Conditions |
Wind Constraints & API Constraints: These parameters are set on the Information tab. LST Start Range: This is set on the Information tab. Assumed LST Start: Two editable boxes are presented, the VLA day and LST start time. When checking an SB, it is important to step through the LST start range you have defined to double check time on source and EL. After entering an assume LST start, either hit enter on your keyboard or click on the Update button. Update: This button can be used to refresh (recalculate) the duration of the SB after changes have been made to scan length or to update an assumed LST start or VLA day. Display UTC times: This button can be used to change the display of LST to UTC in the Summary Report table. Computed LST Stop: After setting an assumed VLA day and assumed LST start time, the OPT will compute the VLA day and LST stop time. Avoid Sunrise & Avoid Sunset: These are set on the Information tab. Assumed Antenna Starting Direction: The default values are 225.0d AZ and 35.0d EL. These fields may be edited to see how changing the assumed antenna starting direction would affect the start of the observation. For example, if the assumed starting AZ is set to 445.0d and the first source is rising, then the antenna may need to unwrap to allow appropriate on source time. Adjusting the assumed starting AZ can also help determine if you have enough start-up time (total duration of the setup scan(s) plus the first calibrator) and which antenna wrap should be requested at the start of the SB. Coordinate System: horizontal
Minimum Elevation Warning: The default is set to the hard EL limit of the VLA antennas, 8.0d. For the safety and integrity of the EL motors, we prefer observers avoid ELs less than 10d, if their sources will allow. The OPT uses this number only as a guide when checking the LST start range of an SB and will give a warning when the EL drops below the set value during a defined assumed LST start time. Setting a minimum EL does not mean the antennas will avoid going below that EL during the observation. Observers must set an appropriate LST start range in the Information tab to avoid the required or desired minimum EL. Shadow Warning Calculations: The default is set to 0.0m (meters). Antenna shadowing only affects observations in C- and D-configuration. (Refer to the Observing Guide for more information regarding antenna shadowing.) Setting a shadowing limit (max) is only a guide for checking the LST start range of an SB. It does not mean the antennas will avoid a set shadowing limit during the observation. Observers must set an appropriate LST start range in the Information tab to avoid the desired shadowing limit. |
| Computed Summaries |
The Instrument Configuration Summary, Time On Source Summary, and Schedule Summary links will take you directly to each table or you may simply scroll down to each table. Each will be described in more detail below. Export Tables as CSV (opens in new window) will create a csv file of the Static Report tab. |
Polar Coordinate Plot
With the 1.37 release of the OPT there is now a polar coordinate plot that is generated for all sources in the SB. The plot is generated with the current LST start and calculates the azimuth and elevation for all of the sources for the duration of the SB. See Figure 4.4.2.
 |
| Figure 4.4.2: Polar Coordinate Plot |
Instrument Configuration Summary
All resources imported into scans within an SB will be displayed in the Instrument Configuration Summary. This table can reveal if the correct or incorrect resources have been imported. Figure 4.4.3 is an example of the resources used in the demo SB seen in Figure 4.4.1. To reveal the subbands within the basebands, click on Show All Subbands. To minimize the view, click on Hide All Subbands or hide individual basebands. If a resource is set up to utilize the Doppler settings, it is advised to double check the OPT's calculation of the line's center frequency using Dopset. Refer to the Instrument Validation section of the Observing Guide for more details on how to verify a spectral line setup.
 |
|---|
|
Figure 4.4.3: Example of an Instrument Configuration Summary table (click image to enlarge). |
Time On Source Summary
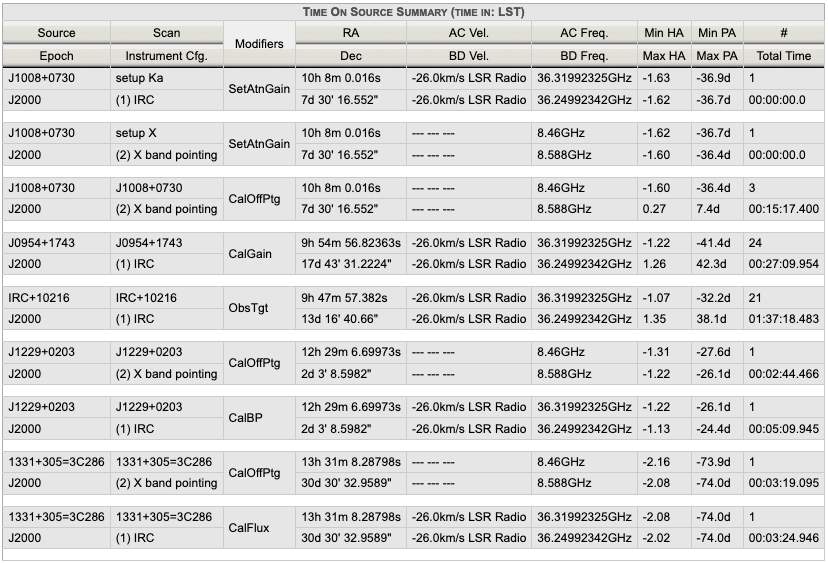
The Time On Source Summary table (Figure 4.4.4) lists all sources used in the scans with their assigned resource, scan name, modifiers (i.e., scan intent(s)), coordinates in RA and Dec, Doppler Velocity used in the assigned resource, Doppler Line frequency of the assigned resource, min and max hour angle (HA), min and max parallactic angle (PA), and total time on source. This table is helpful in determining how much time on source a science target or calibrator with a given resource has for a specific LST start (set in the assumed LST start field in the top portion of the Static Report tab). Note, as the assumed LST start time is changed, the time on source for each source will change. This is due to the change in the antenna slew time between sources due to the change in the sources positions relative to each other on the sky.
 |
|---|
|
Figure 4.4.4: Example of a Time On Source Summary table. |
Summary Report
The Summary Report (Figure 4.4.5) is the most valuable for checking the overall setup of an SB. This is a table view of the scan listing created in the left-hand column. If scan loops have been utilized, be sure to click on the plus icon at the top left of the Summary Report table to expand all loops (including loops within loops). The scan mode, e.g., standard observation (STD) and interferometric pointing (IP), will be listed to the right of the scan number in the first column of this table. This matches the scan mode listing found in the tree structure in the left hand column of the OPT which has scan mode labels, e.g., STD, IP, etc. (Figure 4.4.5).
When checking an SB, it is important to step through the LST start range (defined by the observer in the Information tab) by entering different assumed LST start times at the top of the Static Report tab. This will help determine whether each observing scan (not including setup scan(s)) have the appropriate time on source (after slewing) for the entire LST start range assigned in the Information tab. The AZ and EL should also be carefully checked to avoid antenna wrap issues and EL limits. If an observing scan does not have any time on source (after slewing), that scan will be highlighted in green (as a warning). If a reference pointing (i.e., interferometric pointing (IP)) scan has less than the required 2min 30sec on source, after slewing, that scan will be highlighted in red (as an error). It is ok if setup scans do not have time on source (they will not appear in green or red). The setup scans (for setting the attenuator and requantizer gain levels) do not require the antennas to be on source.
For a more detailed check of an SB, we recommend using the built-in validation tool known as the Dynamic LST Validation tab.
 |
| Figure 4.4.5: Summary table example with requested antenna wrap included |


Connect with NRAO